What's New in GoodData Cloud Native?

Subscribe to GoodData Updates
Receive regular insights from GoodData delivered directly to your inbox.
GoodData.CN 3.44.0
We are introducing a new microservice called api-gw. This service takes over part of the functionality previously handled by NGINX Ingress, including routing of incoming traffic, telemetry, and logging. It is enabled by default, and your deployment will be automatically updated to use it. No manual action is required.
The service is still under active development, and its role will be expanded in future releases. We do not anticipate any issues from this change, but if you encounter problems, please contact GoodData Support. If necessary, you can temporarily opt out by setting the Helm chart attribute deployGateway=false.
For details, see the api-gw section in the Microservices article.
GoodData.CN 3.43.0
To-Date Filters and Day of Quarter Granularity
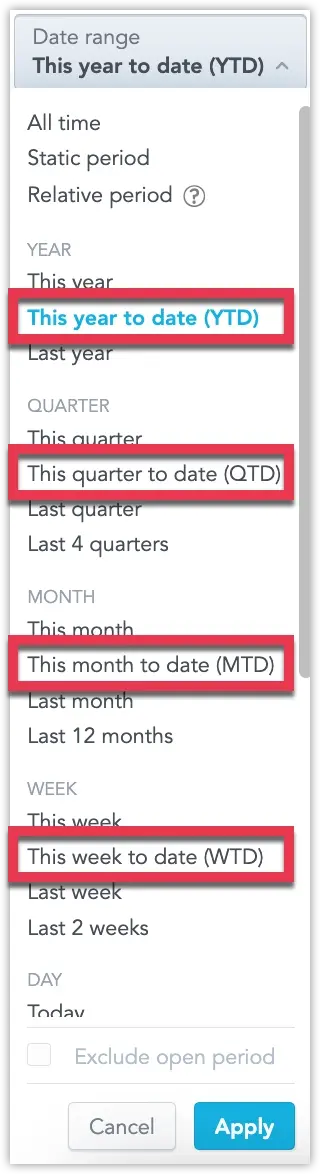
You can now use To-Date values (Year-to-Date, Quarter-to-Date, Month-to-Date, and Week-to-Date) in date range filters. These options make it easy to select data up to the current day, helping prevent misleading comparisons with fully completed historical periods.
For more information, see the To-Date Filters section.
In addition, we’ve added support for to-date filters in metric date filters, and introduced a brand-new Day of Quarter granularity. This lets you group data by individual days within a quarter—ideal for spotting short-term trends that sit between daily and monthly views.
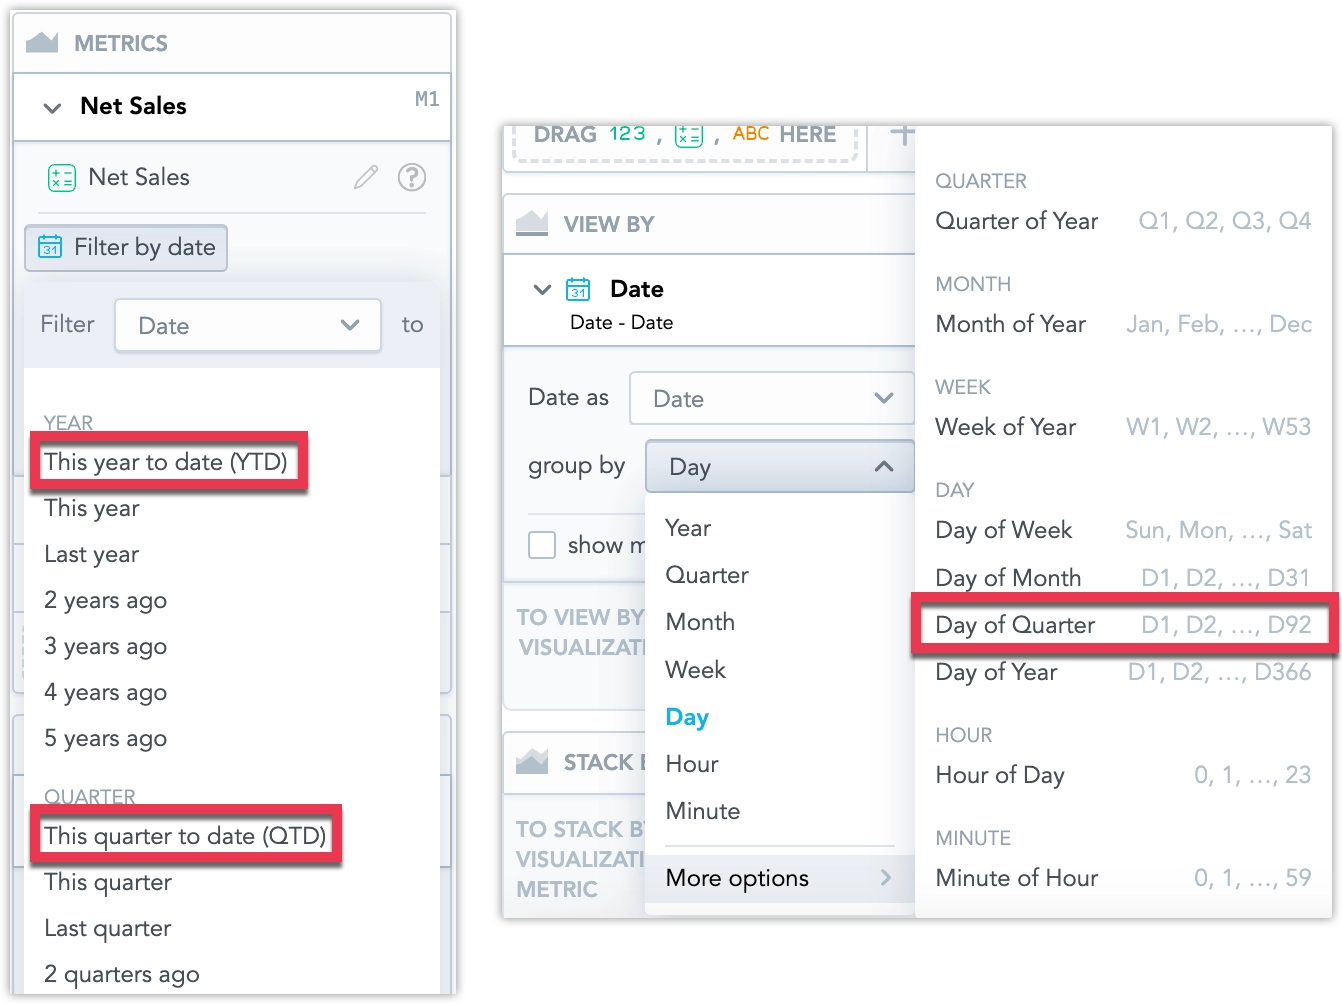
To use the new Day of Quarter granularity, you may need to update your Logical Data Model. See Missing Date Granularity for details.
The legacy telemetry section has been fully removed from the /api/v1/profile endpoint. This field had been marked as deprecated for over a year and is no longer returned in the response.
If your integration relies on the deprecated telemetry section, update to use the telemetryConfig section exposed by this endpoint.
GoodData.CN 3.42.0
We’ve introduced two enhancements to smart search:
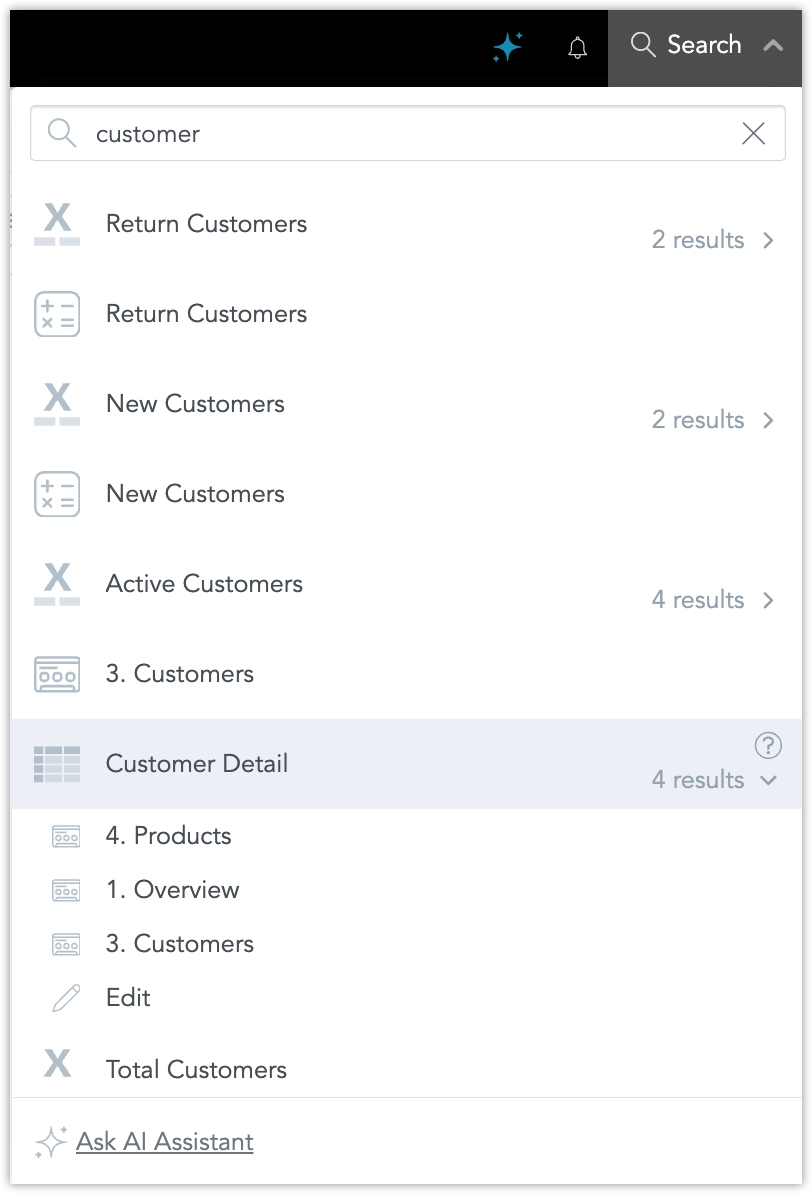
Search results now group identical visualizations used across multiple dashboards into a single expandable result. This reduces clutter and makes it easier to review all occurrences of a visualization. Users can expand the group to see each instance and navigate directly to a dashboard or to Analytical Designer.
Smart Search is also integrated with the AI Assistant. When no relevant results are found, users with access can continue the query in the assistant. The assistant opens with the search term pre-filled and immediately returns an answer or an ad-hoc visualization.
For more information, see Use Smart Search .
GoodData.CN 3.41.0
To-date Options in Date Filters
We have now fully released the new To-Date values for date range filters. These include Year-to-Date (YTD), Quarter-to-Date (QTD), Month-to-Date (MTD), and Week-to-Date (WTD).
These filter values enable you to easily select data up to the current day, preventing misleading comparisons with completed historical periods.
For more information, see the To-Date Filters section.
Apply All Dashboard Filters at Once
You can now enable a new mode that lets you apply all dashboard filter changes in one step, instead of triggering a reload after each individual change. This is especially helpful for dashboards with many filters and visualizations, reducing the number of queries and improving performance.
For more information, see the Apply All Dashboard Filters at Once section.
GoodData.CN 3.40.0
We have redesigned the process for configuring authentication providers. The current process offers greater flexibility and safety when switching from the default GoodData Authentication Provider to a custom identity provider (IdP).
This allows administrators to configure both GoodData Auth and a custom IdP in parallel, and switch between them using a dedicated API endpoint, enabling safer testing and easier rollback without requiring assistance from GoodData Support.
Breaking Change
The organization entity now uses the identityProvider relationship to define which IdP is active. All configuration details specific to the identity provider must be defined in the identity provider entity and linked via the organization settings.
This replaces the previous method of including OIDC-related parameters directly in the organization attributes. The following fields are deprecated and will be removed in a future release:
"oauthClientId": "string",
"oauthClientSecret": "string",
"oauthCustomAuthAttributes": {
  "property1": "string",
  "property2": "string"
},
"oauthCustomScopes": [
  "string"
],
"oauthIssuerId": "myOidcProvider",
"oauthIssuerLocation": "string",
"oauthSubjectIdClaim": "oid"
To configure authentication, define these settings within the identity provider object and link it to the organization using the identityProvider relationship.
For full implementation details, see the Set Up Authentication documentation.
If you experience any issues with authentication after installing this version, you can quickly return to the previous setup by toggling the enableSeamlessIdpSwitch feature flag and setting it to false.
Please also report the issue to us so we can investigate and resolve it.
We’re planning to release SDK 11 at the end of September, and want to give you advance notice of some important changes.
❗ React 19 Support and Deprecations
Based on popular demand, SDK 11 will support React 19, which introduces some breaking changes:
- Support for React 16 and 17 will be removed.
- React 18 will remain supported.
If your data product is built on React 16 or 17, we recommend starting your upgrade now. Reach out to your customer support representative to discuss the next steps.
SDK Lifecycle
SDK 11 will follow the standard SDK lifecycle process:
- SDK 10 will enter End of Development (EoD) on the release day of SDK 11.
- All new features will only be available in SDK 11 moving forward.
We encourage you to upgrade as soon as possible. We’ll share detailed guidance on the upgrade path in the coming weeks.
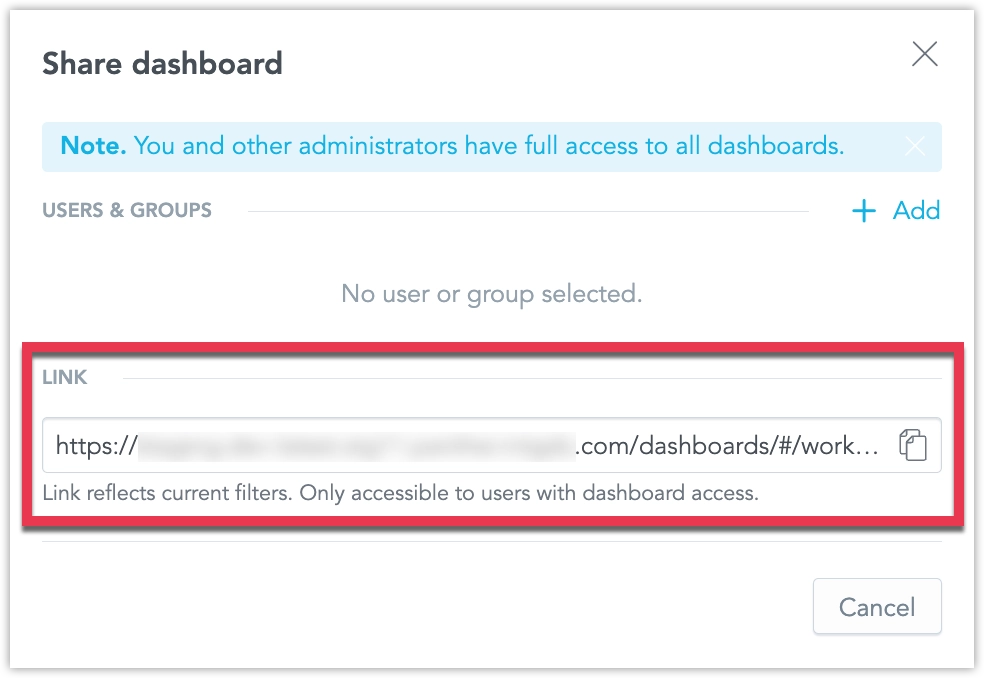
It’s now easier to share a dashboard in the exact state you see it, including all active filters. A new option in the Share dashboard dialog (opened by clicking Share on a dashboard) lets you copy a URL that preserves the current filter settings, so others see the same filtered view.
We are in the process of introducing new To-Date values for date range filters, including Year-to-Date (YTD), Quarter-to-Date (QTD), Month-to-Date (MTD), and Week-to-Date (WTD). These filter values enable you to easily select data up to the current day, preventing misleading comparisons with completed historical periods.
For example, MTD includes data from the first day of the current month up to today. On July 21, 2025, MTD covers the period from July 1, 2025, through July 21, 2025.
When you enable the enableToDateFilters feature flag, these new date-filtering options become available in Analytical Designer, Dashboards, and SDKs, providing consistent filtering logic across manual and automated workflows.
GoodData.CN 3.39.0
The Column container is now available in production, giving you more flexibility and control when building dashboards. It lets you group multiple widgets in a single vertical stack, improving layout, alignment, and responsiveness.
What’s new in the full release:
- You can now use Column containers in the Plugin SDK.
- If you use Analytics as Code, you can add or update Column containers and define their content directly in VS Code.
- In Dashboards, when you add a Column container to the canvas, it behaves like a vertical stack by default. However, you can easily change the layout direction if needed.
- Content inside the container automatically resizes to match the container’s width.
- You can nest one Column container inside another.
- We have improved drop zone indicators to make adding and arranging widgets more intuitive.
Benefits:
- Better control over layout and widget sizing
- Cleaner, more organized dashboards using stacked visualizations
- Improved responsiveness and usability
- Easier migration from legacy dashboards to GoodData Cloud
For more information, see the Column Container section.
We have fixed a bug that could cause workspace data filters (WDFs) to stop working correctly after updating the logical data model (LDM) in a parent workspace.
What was the issue:
- When the parent workspace LDM was updated, child workspaces could lose their WDFs.
- Reapplying the same LDM didn’t fix it because the backend thought nothing had changed.
- This happened when parent datasets had no WDFs, but child workspaces added WDFs to those datasets.
- Changes to the LDM using those datasets in the parent prevented WDFs from being properly applied in the child.
Also fixed:
- In some cases, large
PUTrequests with manydatasetExtensionscaused 500 errors due to database load.
These issues are now resolved and no action is needed on your side. However, if your WDFs were affected before this fix, follow these steps:
- Send a
PUTrequest with a small change to the LDM in the child workspace. - Then send the full, correct LDM.
GoodData.CN 3.38.0
We are introducing AI assistant, a conversational interface that lets you explore data in plain language inside GoodData Cloud. Ask questions in natural language, no SQL or MAQL required. Every query passes through your existing semantic model, so results always respect business terminology, metrics, and security filters. Only metadata is sent to the language model; raw data never leaves GoodData.
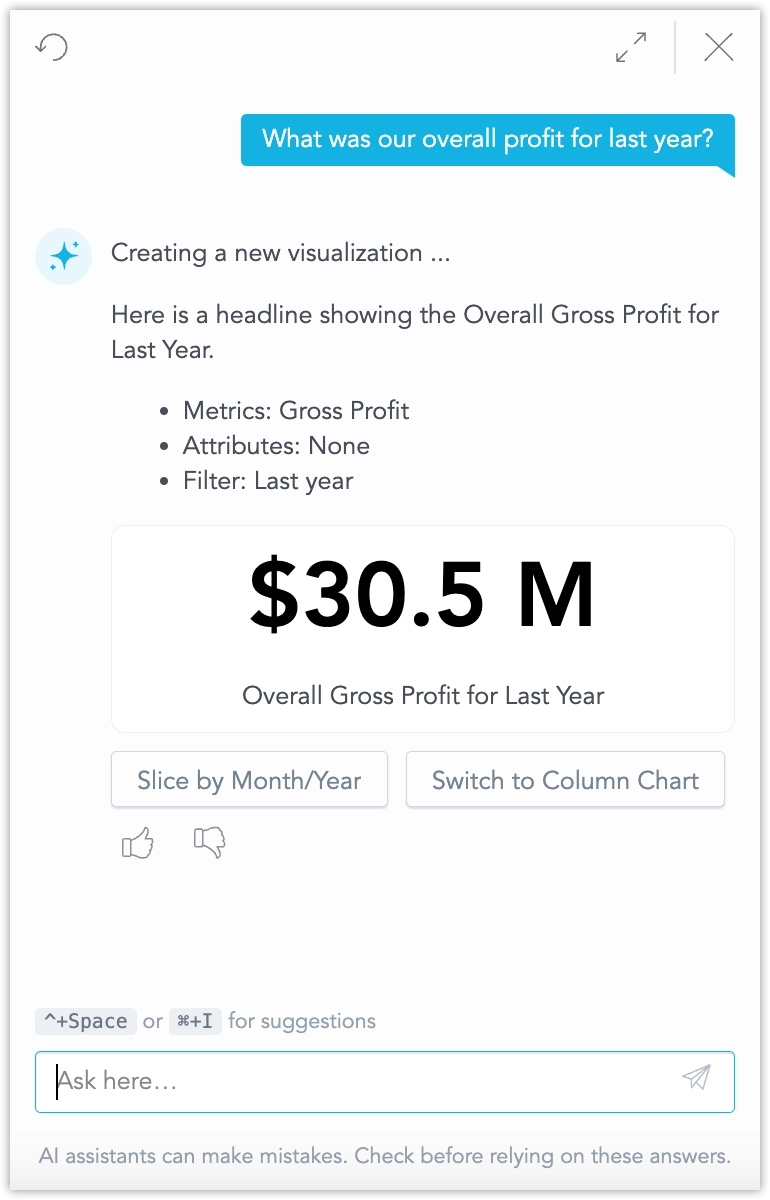
The assistant is designed for everyday tasks:
- Ask general business questions for quick insights into your data.
- Generate new visualizations on the fly and iterate on them.
- Save generated visualization and use them in your dashboards right away, or work on them further in Analytical Designer.
- Search for specific dashboards, visualizations, metrics, facts, and attributes without leaving the chat pane.
- Continue a conversation in context; the assistant remembers prior questions inside each workspace.
See Use AI Assistant for details and instructions on how to set it up.
This initial feature release is hidden under the enableGenAIChat feature flag. Enabling the feature flag requires additional steps, see Upgrade GoodData.CN - Version 3.38.0. Unlike most feature flagged features that become generally available within two GoodData.CN releases (1 month), we plan for the AI Assistant to remain an opt-in feature until September.
Workspace search is a new functionality that lets you search your workspaces for dashboards, visualizations, and metrics using natural language. The search understands synonyms, tolerates typos, and supports several non-English languages, making it easier to find what you need, even if you’re not sure what it’s called.
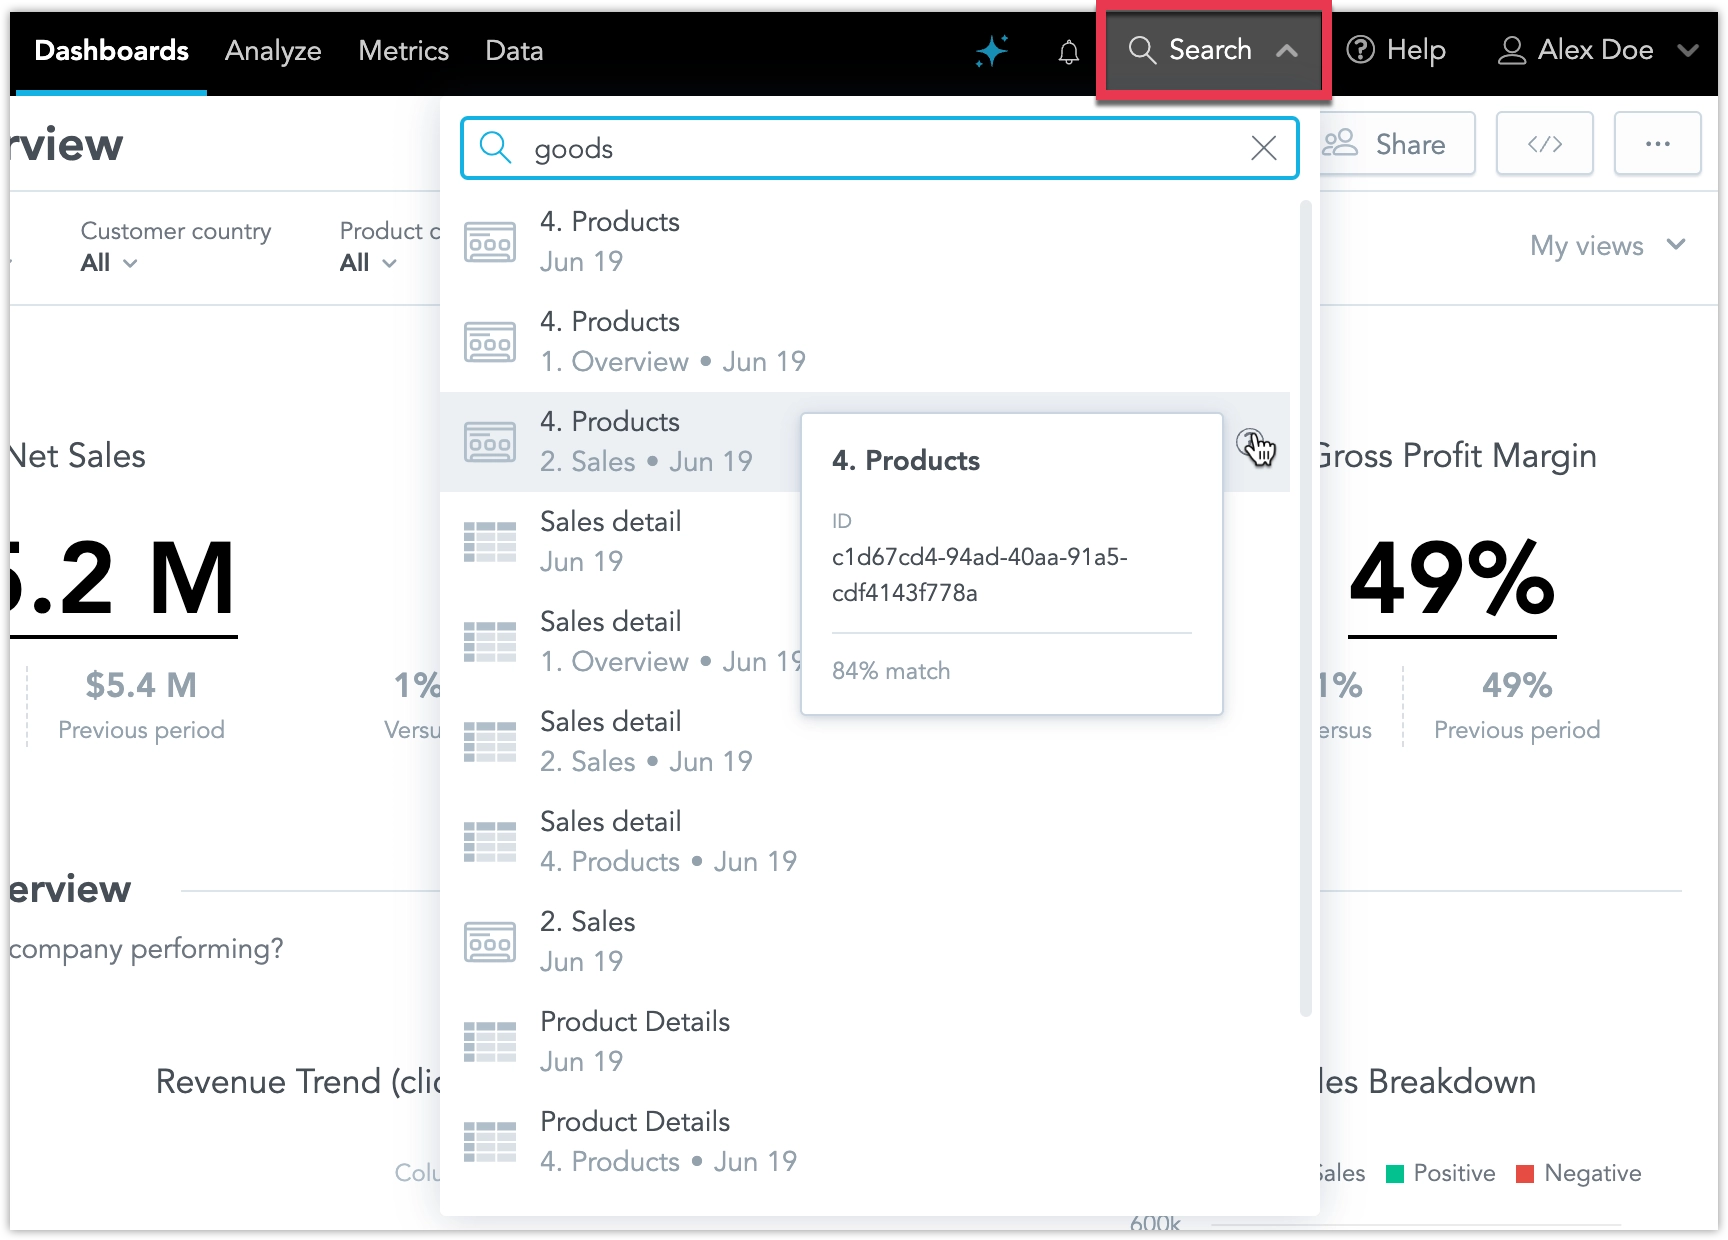
See Search Workspace for details.
This initial feature release is hidden under the enableSemanticSearch feature flag and enabling the feature flag requires additional steps, see Upgrade GoodData.CN - Version 3.38.0
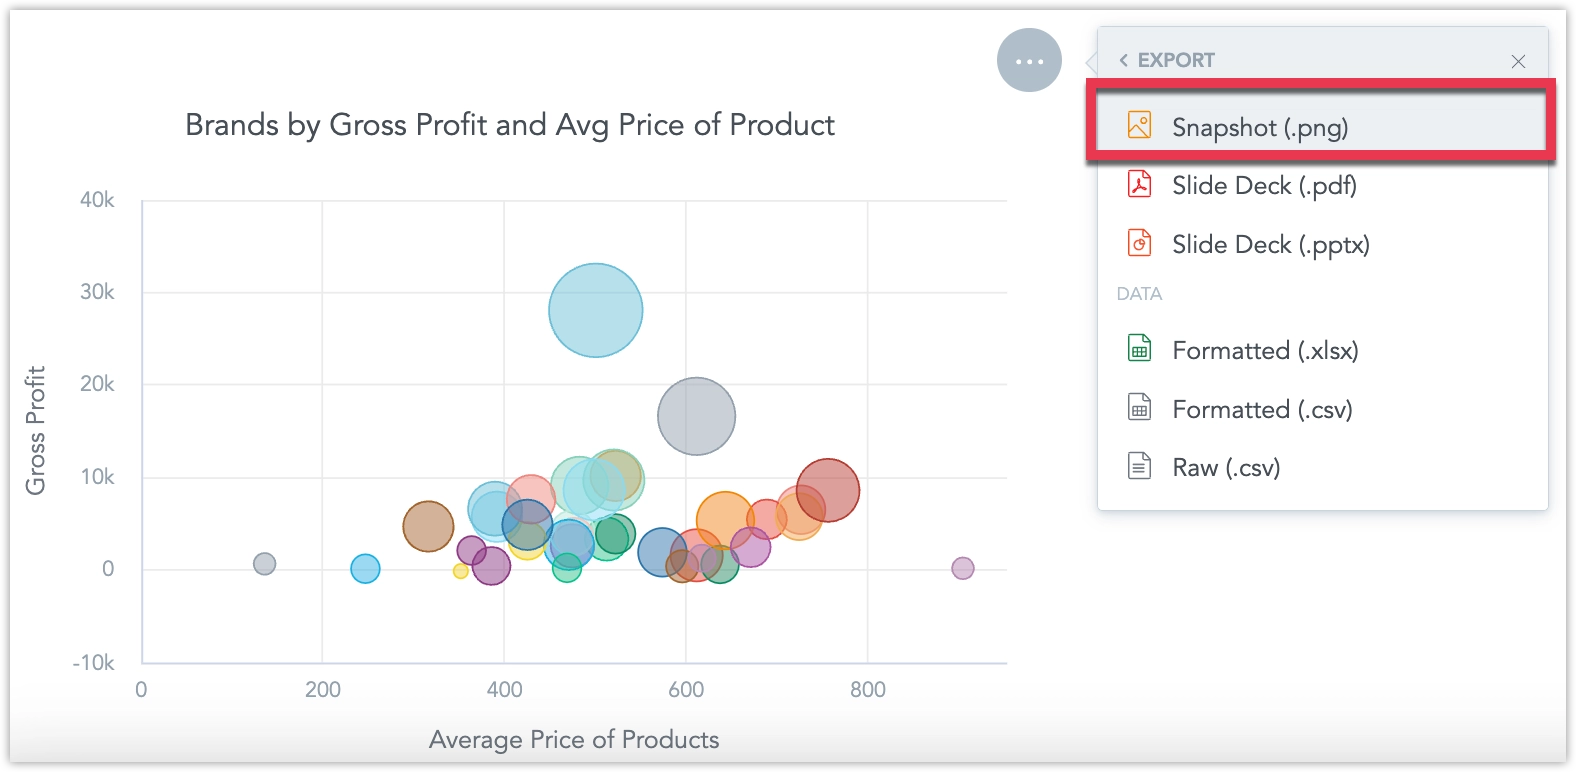
You can now export snapshots of dashboard widgets as PNG images, see Export Widget for details.
We’ve fixed a bug that caused legends in dashboard visualizations to appear in incorrect positions. Previously, legends did not consistently reflect the position settings configured in the Analytical Designer.
With this fix, legends will now reliably follow the position specified, unless the legend position is set to auto, in which case the system will determine the optimal layout.
To ensure your dashboards continue to display as expected, we recommend reviewing them and checking the placement of chart legends. If any adjustments are needed, you can update the legend positions directly in the Analytical Designer.
New Language Support
We have expanded the language options for our user interface to include Korean, Polish, and Turkish. These languages are now fully supported in the Analytics Designer, Dashboards, and Metric Editor.
See the Change Display Language section for details.
We have introduced an important improvement to how executions are handled to optimize database load and reduce response times.
Now, when you interact with dashboards or build visualizations, such as changing filter values or swapping metrics and attributes in Analytical Designer, any unfinished queries from previous actions are automatically stopped. This ensures that only the query corresponding to the most recent action is executed, avoiding unnecessary use of backend resources.
Previously, every action triggered its own separate execution. Once started, these executions couldn’t be canceled, even if you changed your selection right away. This often led to queries continuing to run in the background even though the UI no longer needed their results, putting unnecessary strain on data sources.
With this update, the system focuses on delivering results for your latest action, which is what you typically want to see. The backend is now smarter about managing resources, especially when accessing raw data sources, which have limited capacity for simultaneous connections and queries.
This enhancement helps ensure faster results, more efficient resource use, and a better overall experience as you explore and analyze your data.
GoodData.CN 3.37.0
You can now export any dashboard directly to an Excel (.xlsx) file. Each visualization is placed on its own worksheet, making it easier to share data, run ad-hoc analysis, and integrate results with other reporting tools.
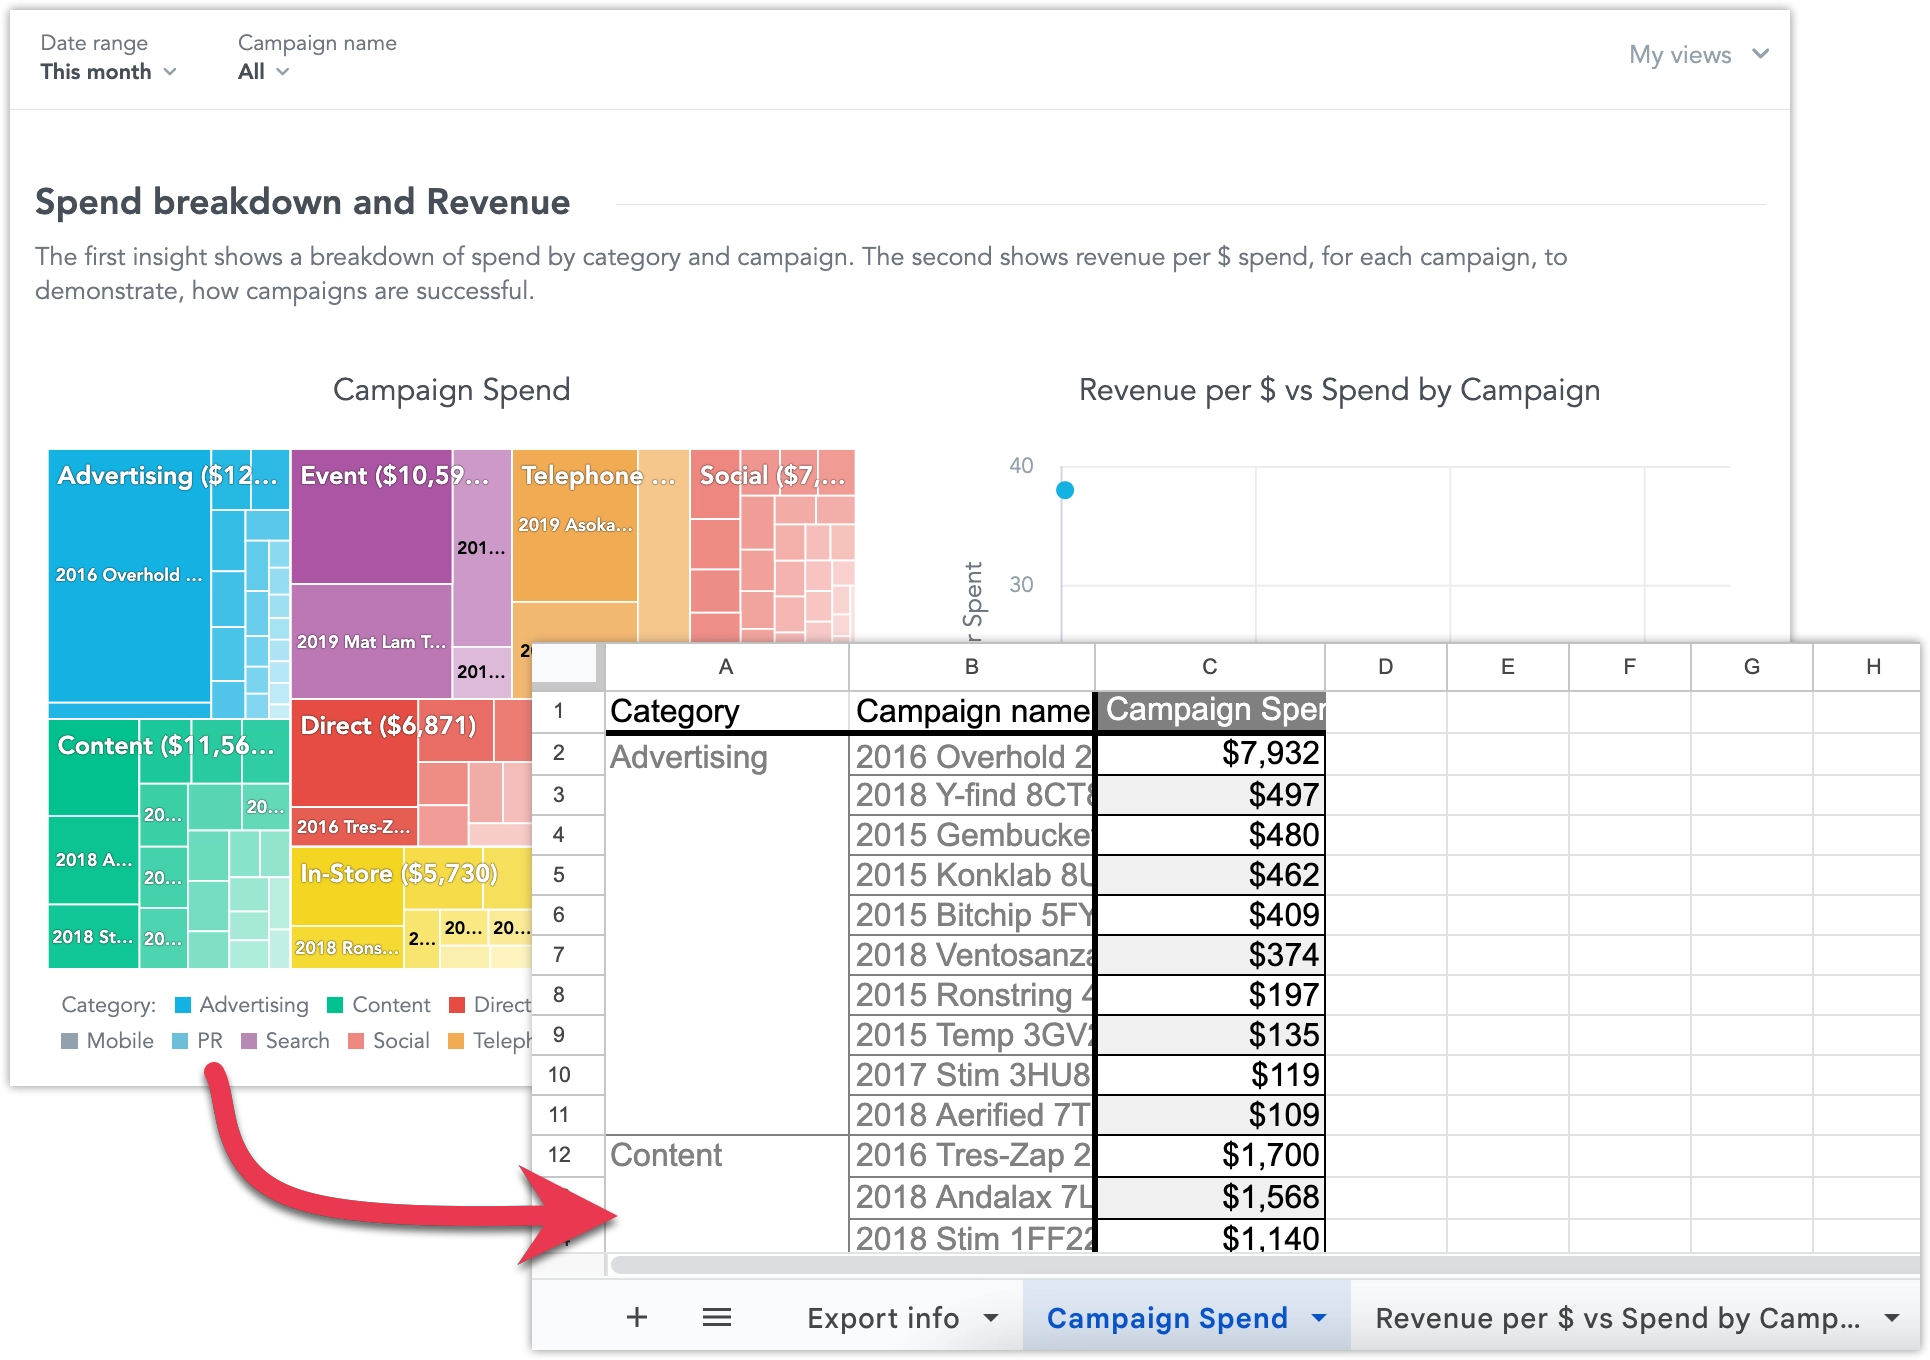
See Export Dashboards for more details.
You can now display charts on your dashboards as tables using the new Show as table button. This lets dashboard users view the widget’s data in a more universally accessible format. The table retains the chart’s drill-down functionality: users can click values to drill into the data, and any drilled-down visualizations automatically open in table view.
This feature isn’t available for Pivot Table, Repeater, or Headline widgets.
You can now visually distinguish between complete and incomplete data in line charts by applying dashed and solid line styles. The line style is driven by a control metric that is not displayed in the visualization.
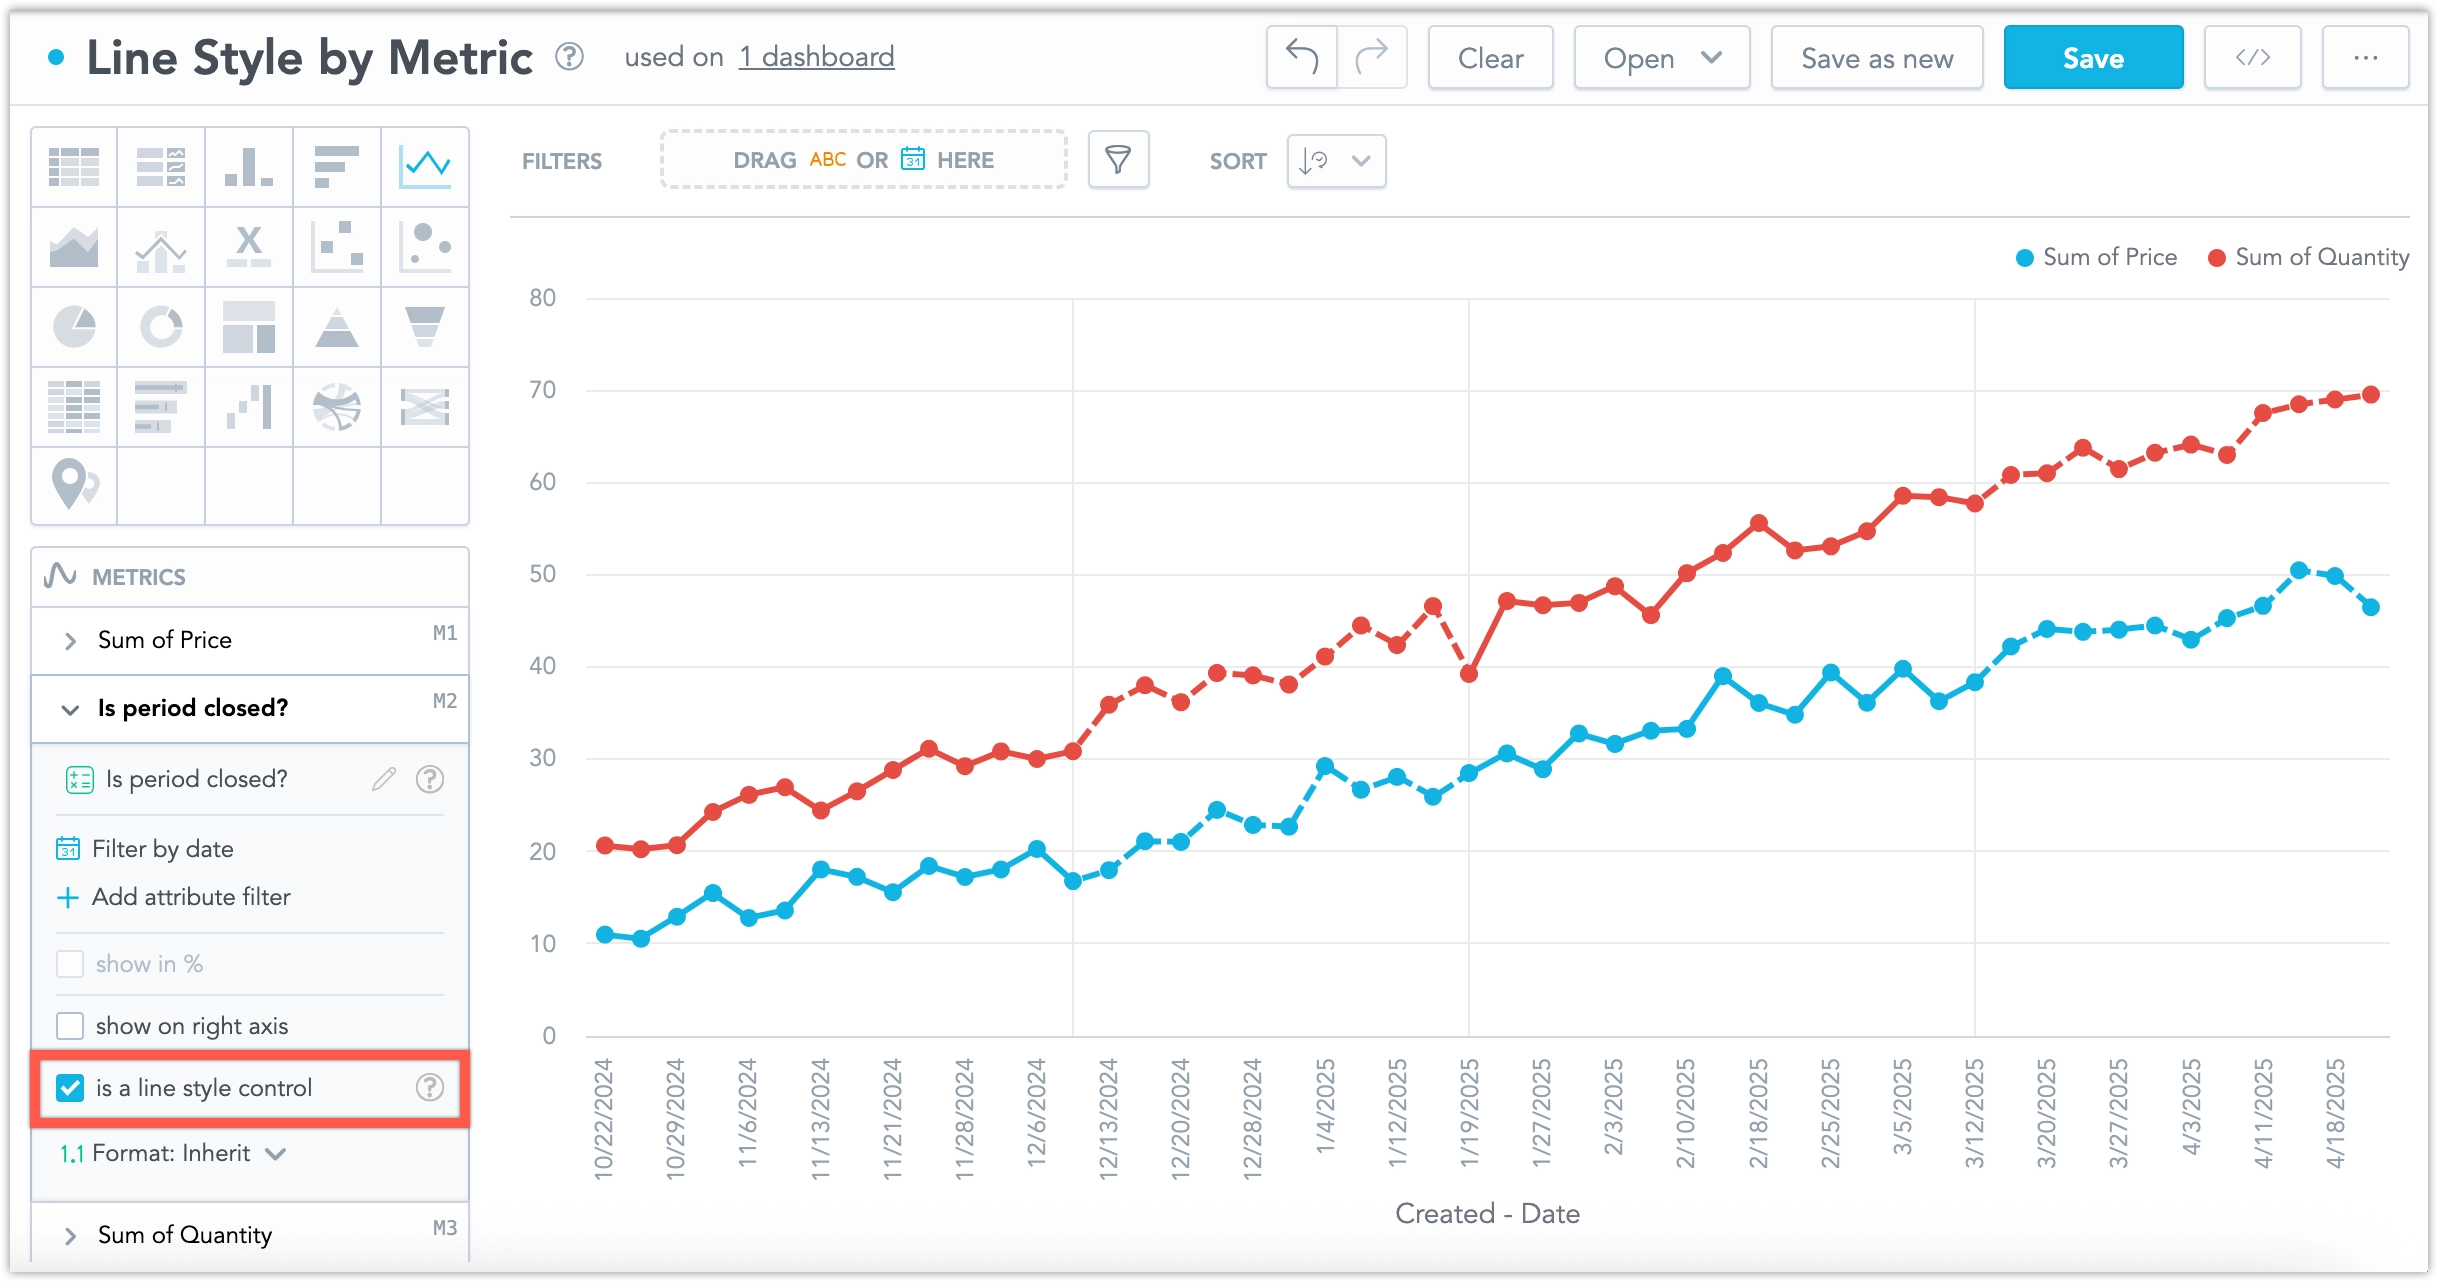
This is especially useful when recent data may still be changing. For example, if the last three months of data are considered incomplete, you can use this feature to show those months with a dashed line, while earlier (completed) months appear as a solid line.
For more details, see the Line Style by Metric section.
The bitnami/etcd subchart has been upgraded to version 11.3.6. This release improves etcd cluster stability when pods are restarted. If you disabled this subchart installation by setting useInternalQuiverEtcd: false, you are not affected.
Upgrading the etcd subchart is seamless and does not require any additional action.
GoodData.CN 3.36.0
In the Embed dashboard → Iframe dialog, we have added a new option Dashboard filters. Toggling this on adds the active dashboard filters as query parameters in the URL itself, letting you embed or share the dashboard with a specific configuration for cases where using postMessages or saved views might be inconvenient.
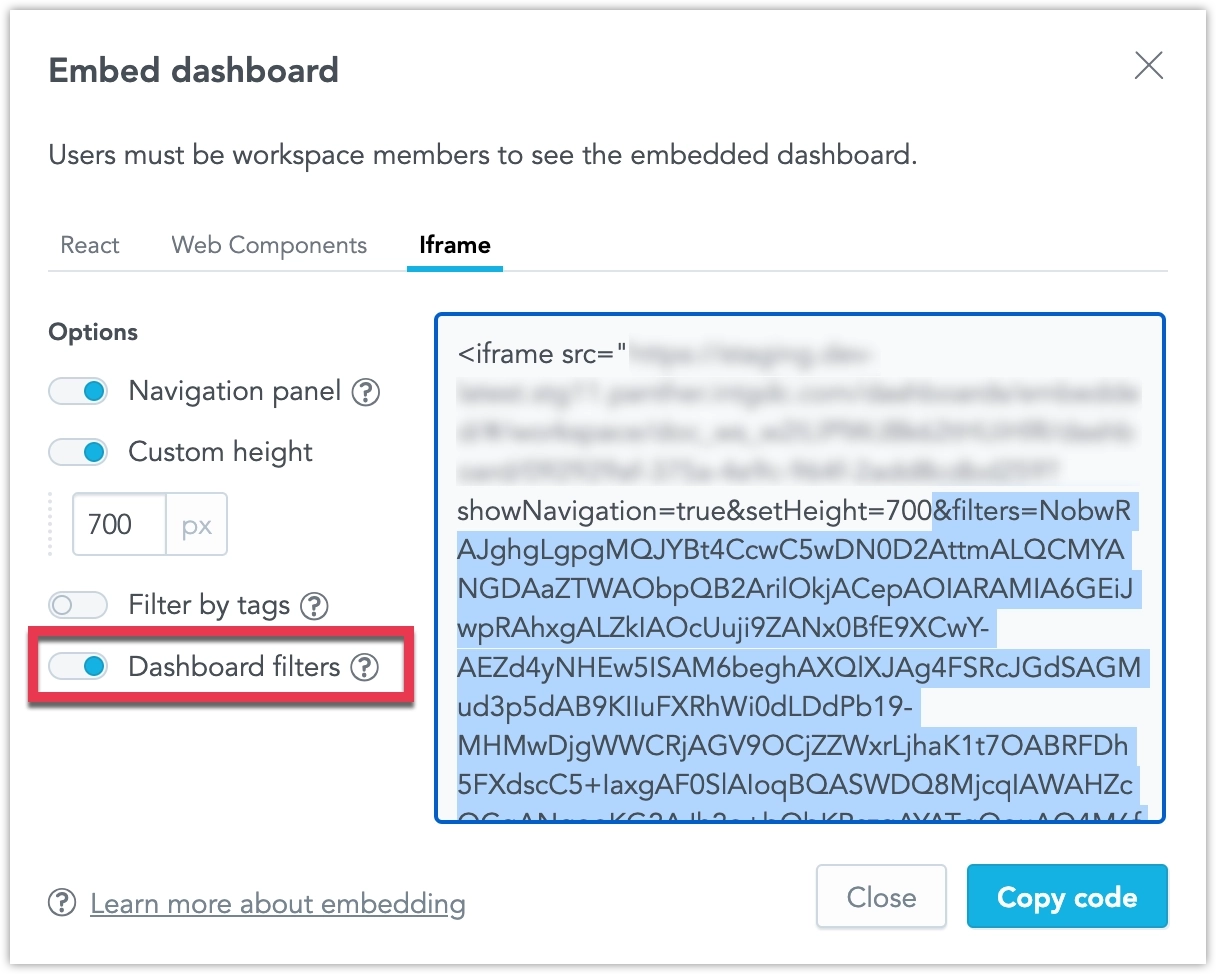
This feature is now out of early access and ready for use in production environments.
We have completed a comprehensive overhaul of how dashboard date and attribute filters are applied in your alerts and scheduled exports (automations). When you create or edit an automation, a new filters section now lists every filter in use together with its current value, and you can add, modify, or remove them directly in the dialog.
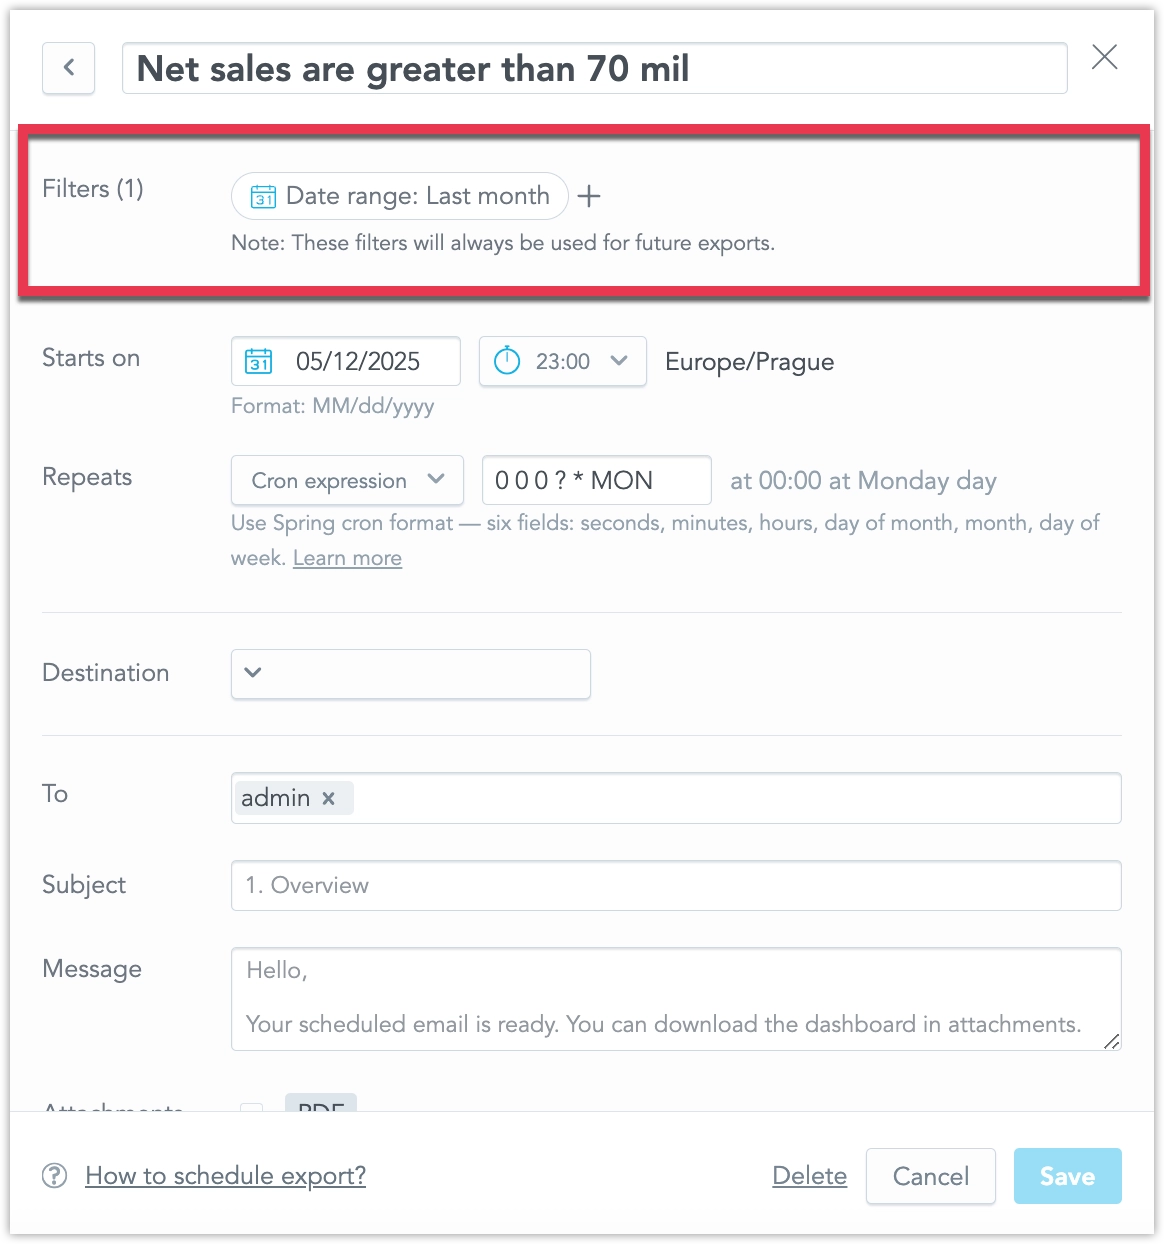
The same filter context now appears in two more places for complete transparency: it is included in the notification e-mail sent with each alert or export, and it can be reviewed via a new filters pop-up available from every item in the in-app notification panel.
This set of features is the reason why we’ve added the localIdentifier property to dateFilter objects a couple of weeks ago. If you are using GoodData declarative API in any of your custom applications or workflows, please review Date Filters Now Require ID Property.
This initial feature release is hidden under the enableAutomationFilterContext feature flag, see Feature Flags to learn how to opt-into this feature.
We are making the error responses for object creation and update operations more specific:
- 409 Conflict is now returned when trying to create an object that already exists (previously 400).
- 400 Bad Request remains for other invalid edits.
This initial feature release is hidden under the enableImprovedHttpStatuses feature flag, see Feature Flags to learn how to opt-into this feature.
GoodData.CN 3.35.0
You can now access a self-service audit log to store and analyze audit events from your GoodData workspace. This new feature empowers your SecOps team to easily investigate who made changes, when, how, and what was changed in your solution, which is especially valuable in case of an incident.
The audit log can support you in several critical areas:
- Security & Fraud Prevention – Monitor unauthorized or suspicious activity.
- Compliance & Legal Requirements – Meet GDPR, HIPAA, or SOC2 standards.
- Troubleshooting & Support – Quickly trace issues and understand changes that impact your setup.
The self-service audit log gives you greater transparency, control, and security when managing your data and analytics environment.
See the Audit Log section for more details.
The dashboard slide deck exports are now a fully integrated feature and on by default.
GoodData.CN 3.34.0
We’ve upgraded the chatbot’s metric-detection logic for visualization requests. Previously, it sometimes chose facts or attributes instead of your saved MAQL metrics; now it consistently picks the right metrics, so the visualizations you receive align far better with your question.
Note that AI Assistant is an early access feature that is not available to all customers by default.
GoodData.CN 3.33.0
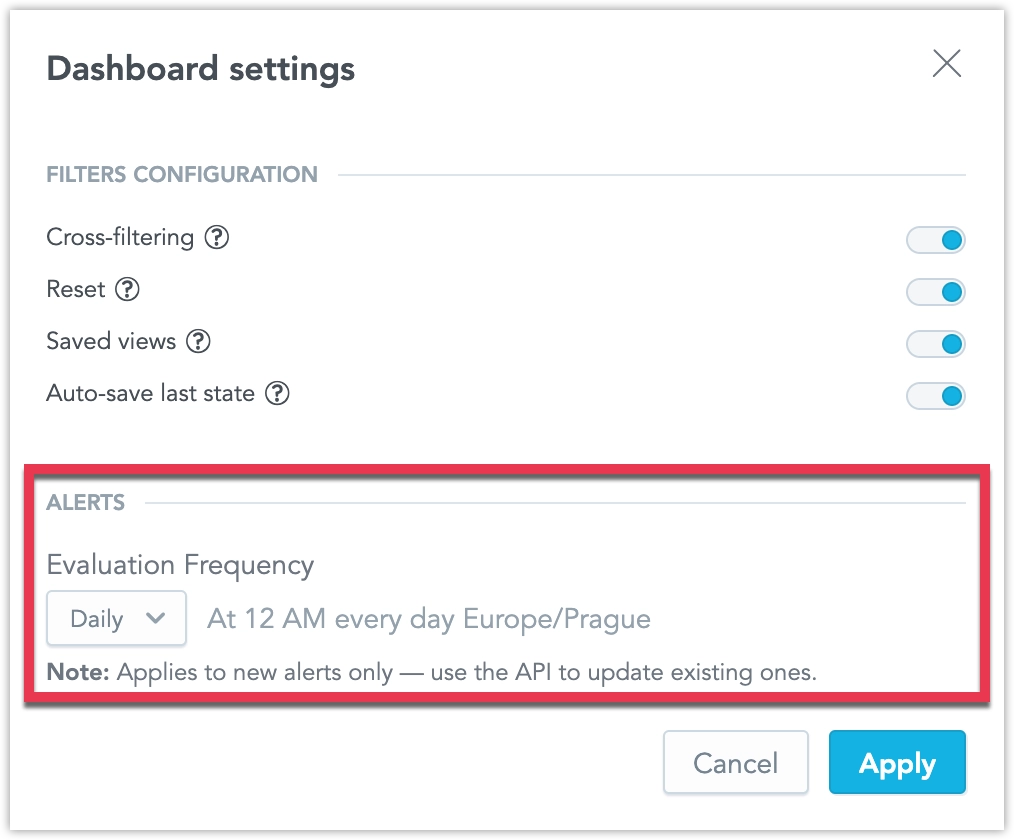
We giving users more control over how frequently their alerts are evaluated. Until now, all alerts have been evaluated according to the evaluation frequency setting shared by your entire organization.
Now, dashboard creators can edit the evaluation frequency in the dashboard’s settings. They can customize the evaluation frequency for all alerts created in that particular dashboard, which overrides the default setting from the organizational settings. This setting applies only to alerts created after the dashboard setting has been changed; it is not applied retroactively to existing alerts.
Note that the old cogwheel icon which opened a dropdown with toggleable dashboard configuration has now been replaced by a dedicated Settings button:
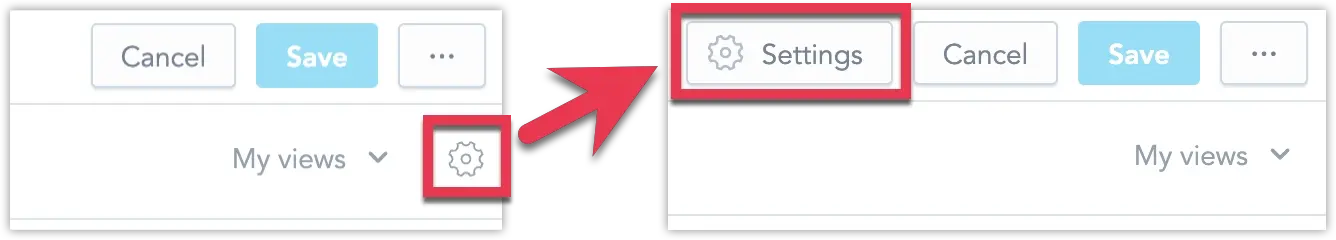
When clicked, this button opens a pop-up dialog that now also includes the new evaluation frequnecy setting:
Furthermore, users can now edit the evaluation frequency for each individual alert separately using the API. See Create Alerts in Dashboards for details.
We have added a new raw data export option, allowing you to download the data used to compute a report.
If your report is based on large raw data that exceeds GoodData limits, the report may not be computed. With this feature, you can still access the underlying data, even if it cannot be visualized. Even when limits are not exceeded, raw data exports can be useful for further processing in external systems.
- Data is exported in CSV format (raw).
- The exported file is not cross-tabulated, ordered, or formatted.
- Metrics are not formatted in the output.
This feature provides flexibility for handling large datasets and integrating with other data processing tools. See the CSV with Raw Data section for more details.
GoodData.CN 3.32.0
Rich text now supports referencing attributes and metrics within your rich text widgets, dashboard section descriptions, widget tooltips, and metric or attribute descriptions. This lets you embed live data, filtered according to any applied dashboard filters, directly into your text.
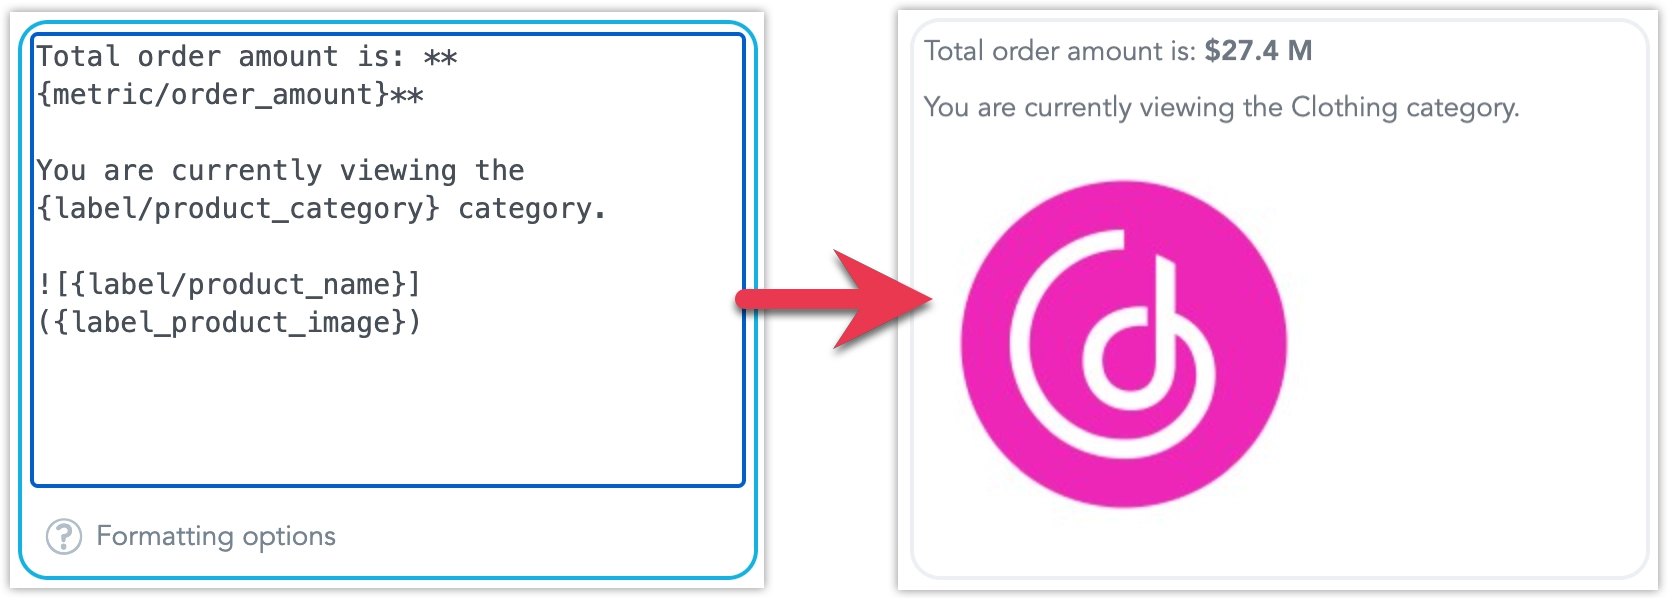
See Add Rich Text to Dashboards for more details.
We have introduced a new way to export entire dashboards or individual widgets as slide decks. You can generate your presentation in either PDF or PPTX format, making it easier to share insights in meetings or keep stakeholders updated. API users can also apply custom templates to control the look and content of individual slides.
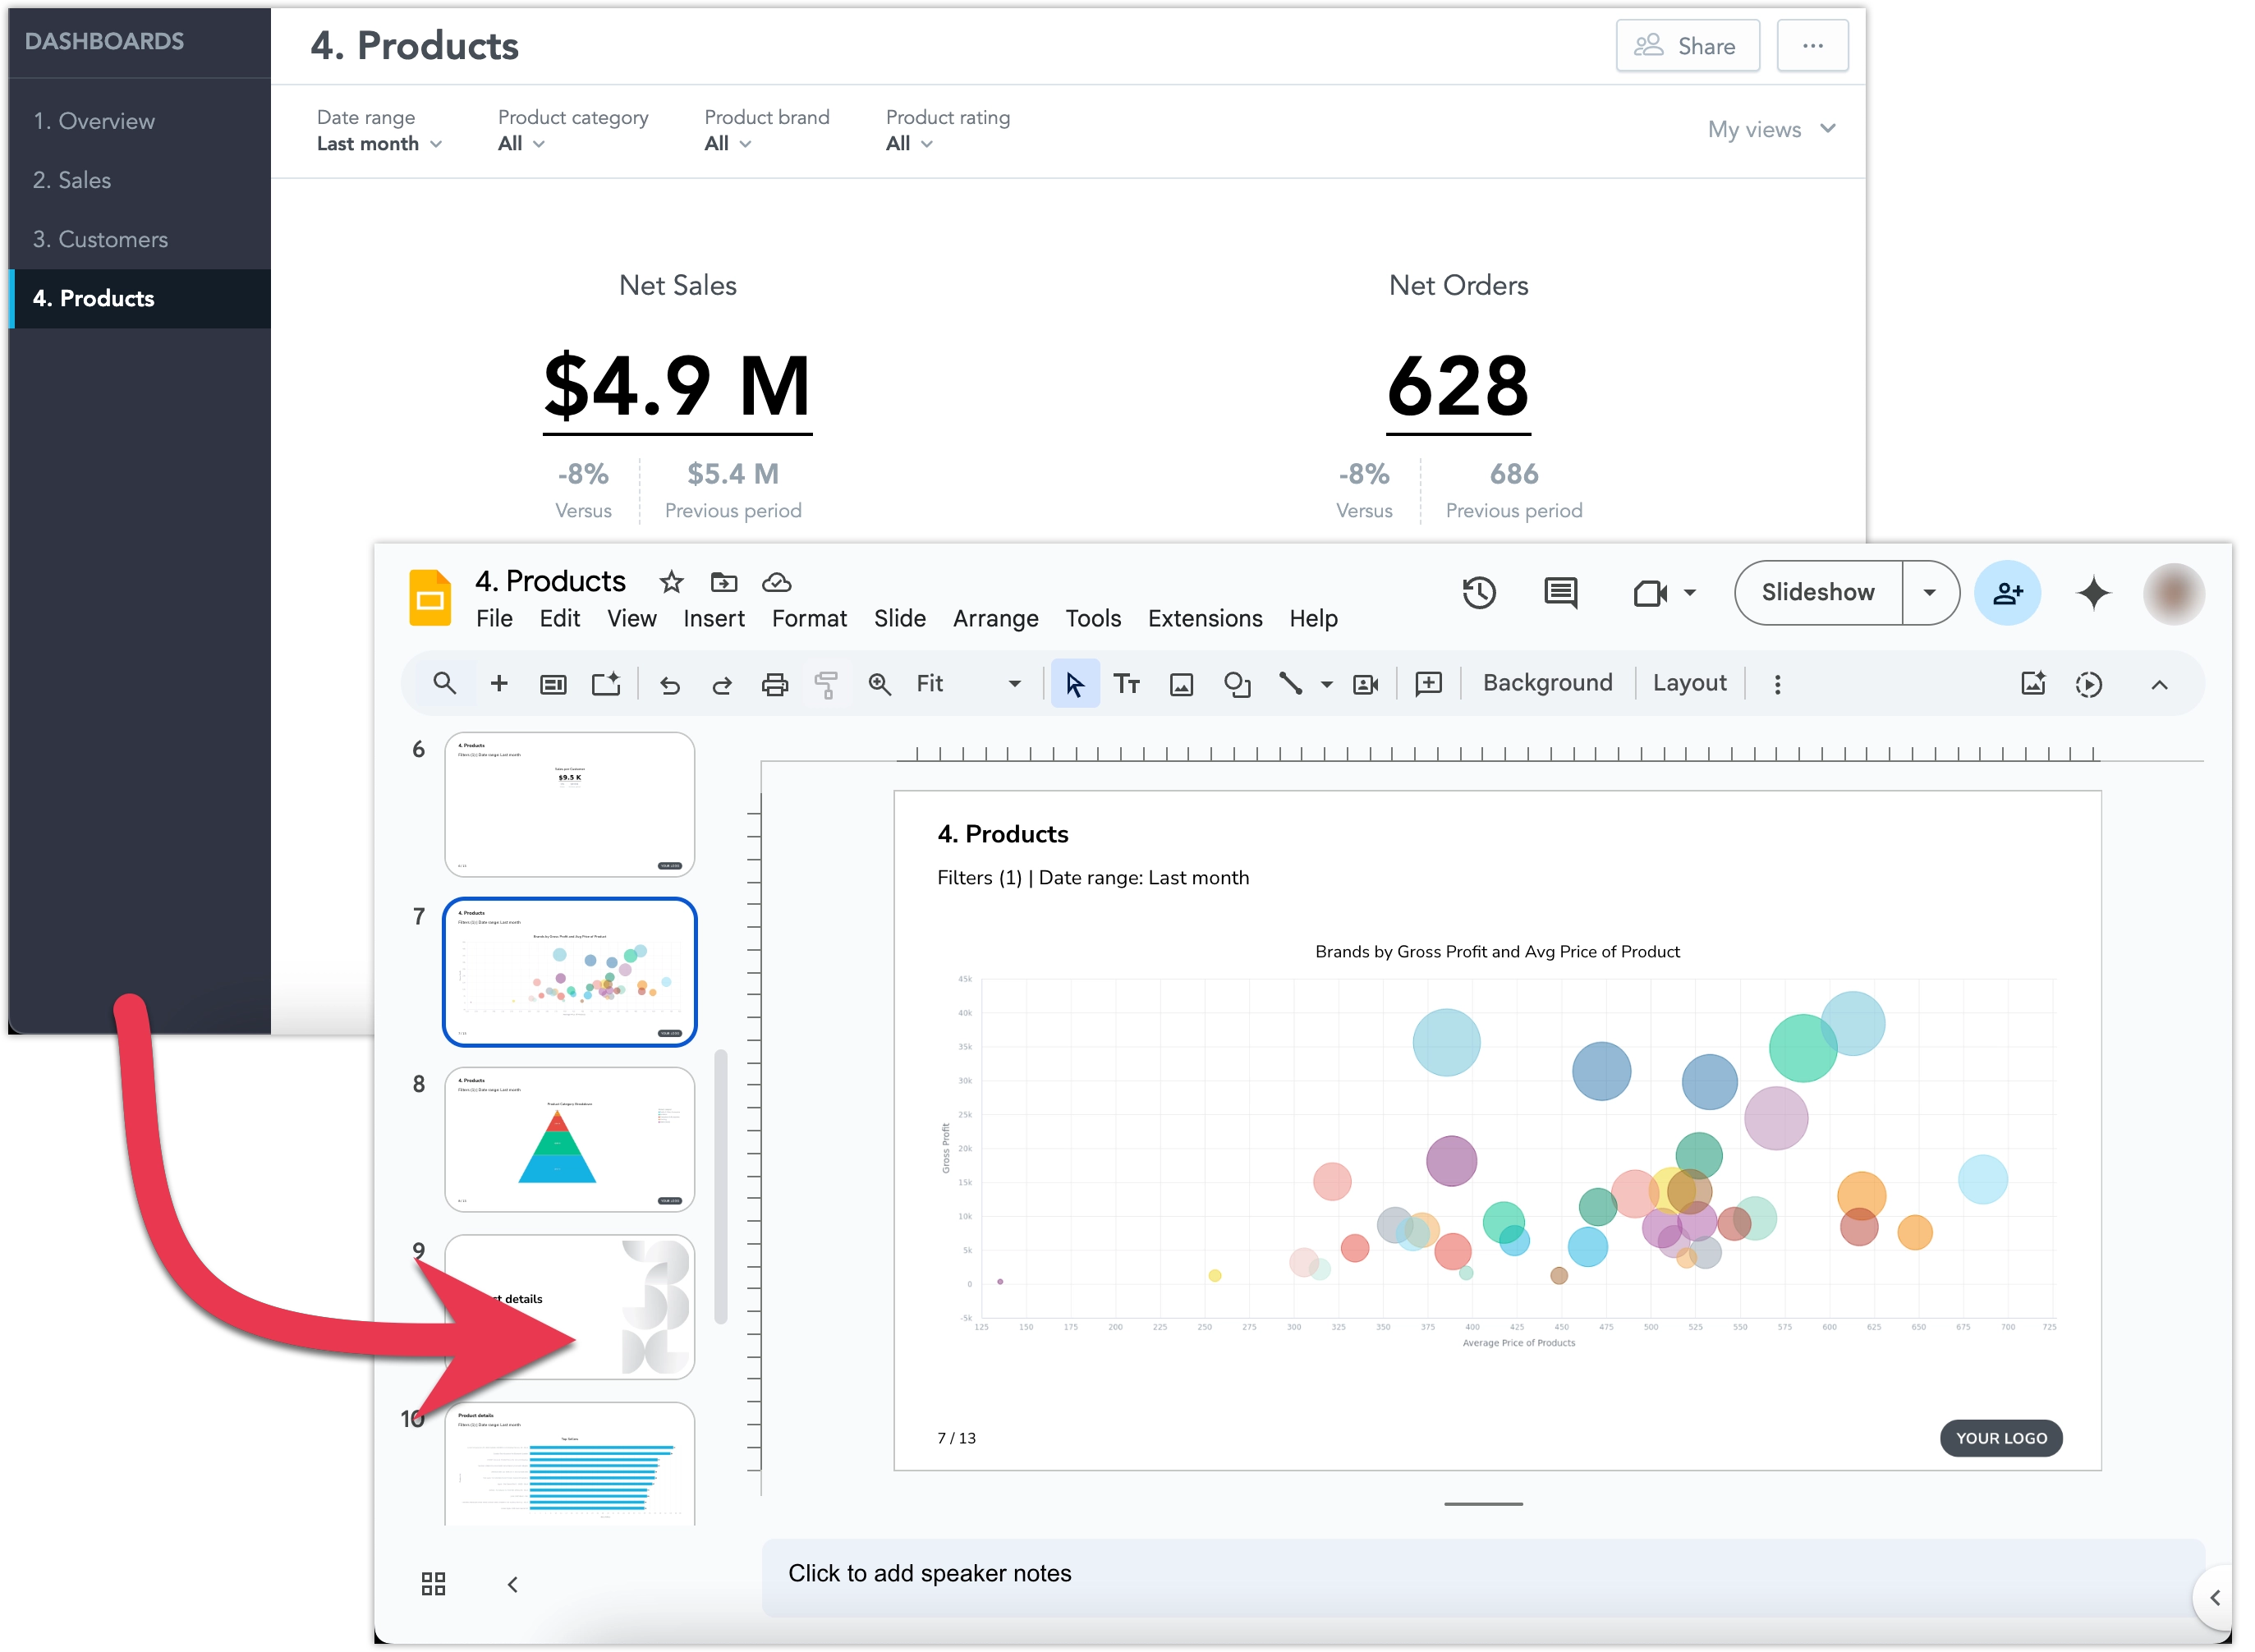
See Export Dashboards for more details about the feature.
This initial feature release is hidden under a feature flag and enabling it may also increase the demands on your Kubernetes resources, see Upgrade GoodData.CN - Version 3.32.0 guide for details.
GoodData.CN 3.31.0
In April, Snowflake will begin transitioning to an M2M (machine-to-machine) authentication policy. You can read more about it in this article on Snowflake’s website.
As a result, basic username/password authentication will no longer be supported for Snowflake data sources. To continue using your Snowflake data, you must update your data source settings to use Key-pair authentication.
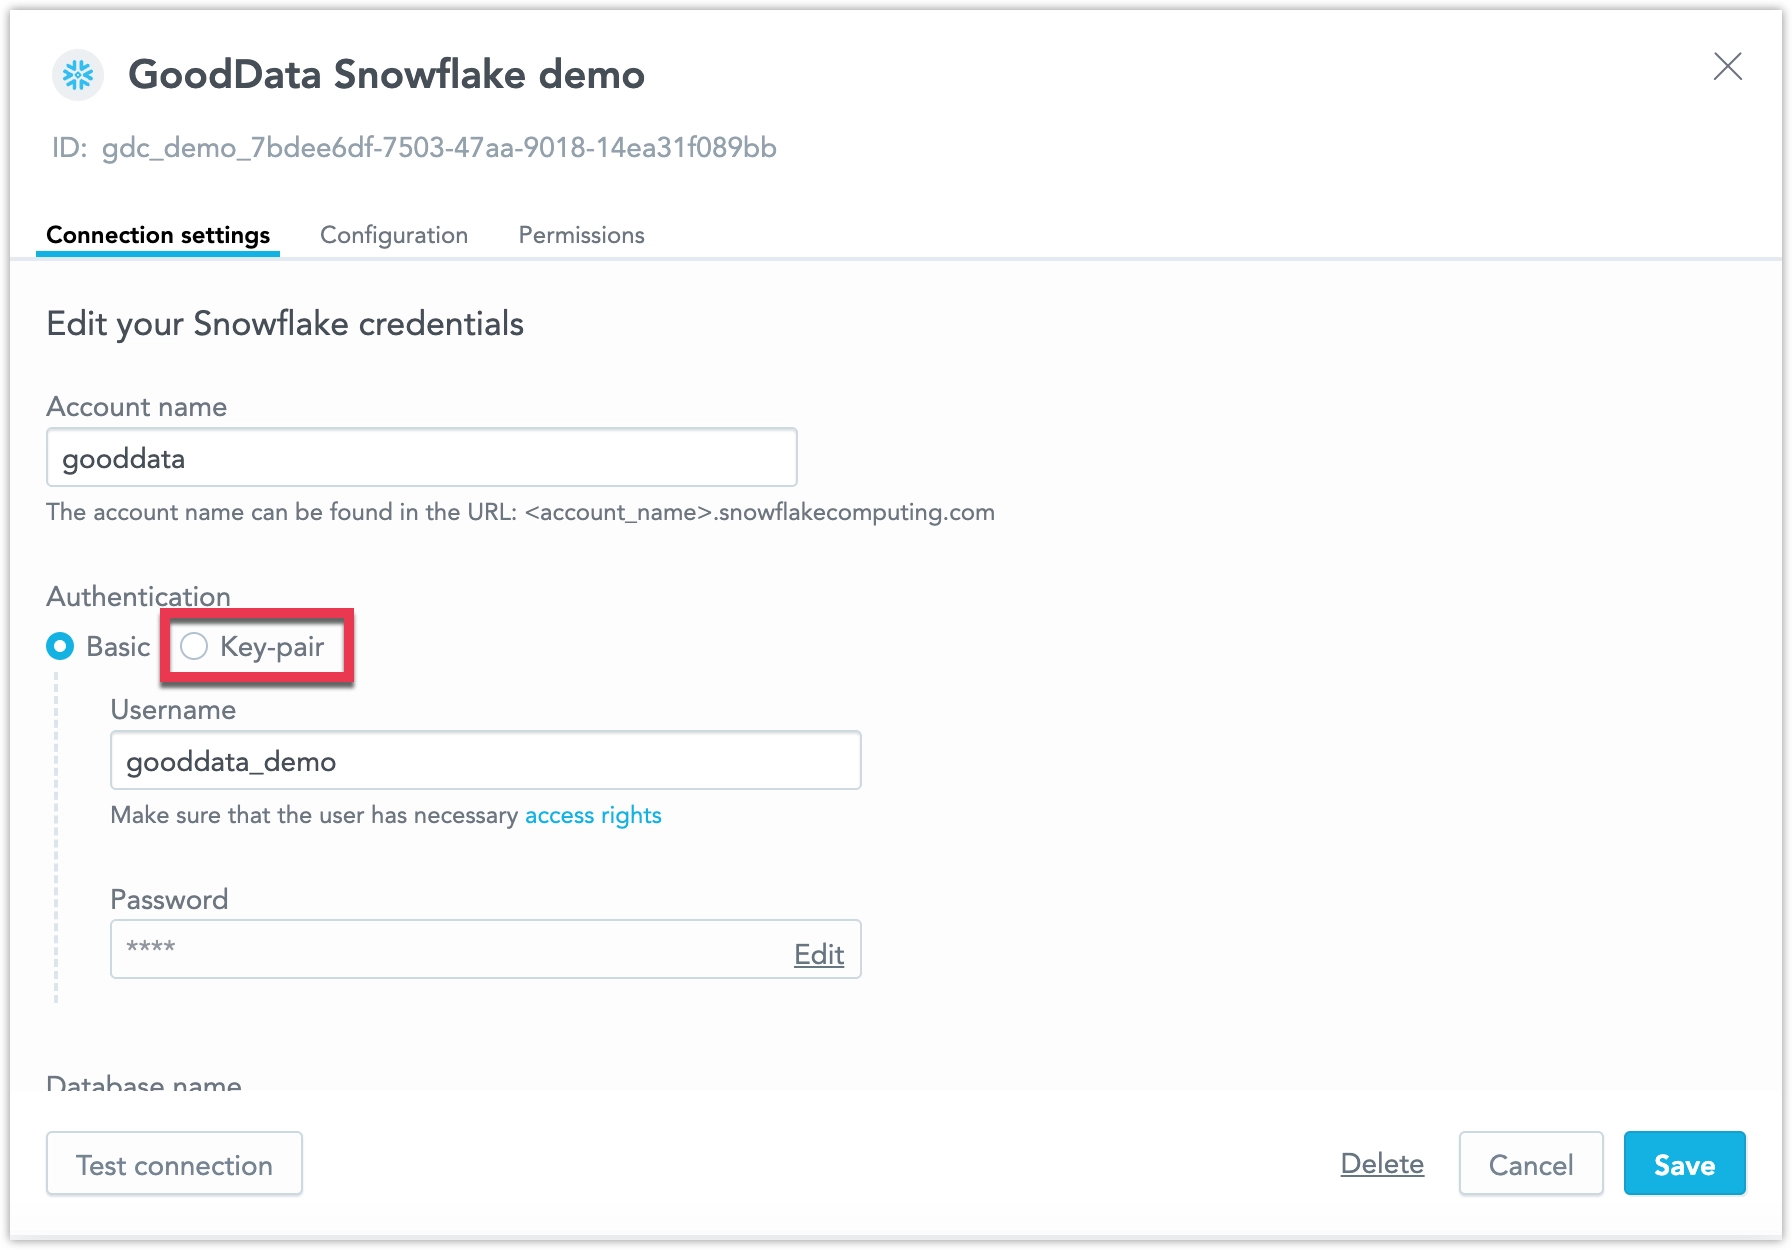
Please make this change by the end of March to avoid losing connectivity. While it’s possible to temporarily work around this by switching your Snowflake user type to LEGACY_SERVICE (as described in the Snowflake article), this workaround will stop working in November. After that point, only key-pair authentication will be supported.
We are improving the accessibility of our Dashboards, making it easier for users with disabilities to navigate and interact with dashboard content. This bring us closer to full compliance with accessibility standards and make dashboards more usable for everyone. More improvements will be introduced in future updates.
GoodData.CN 3.30.0
We are updating the engine behind our visualizations to improve performance and accessibility. This update fixes several long-standing bugs and lays the foundation for faster, more accessible visualizations.
As part of this update, you may notice some small but important changes to the appearance of your existing visualizations:
- More space is allocated for each label, which may reduce the total number of labels displayed on axes with high label density. Some labels may be hidden if there isn’t enough space.
- Labels are now less likely to rotate when space is limited.
- Minimum and maximum values for chart axes now round up or down to the nearest whole number, which may slightly adjust the axis range.
- A more advanced approach to zero alignment on dual axes may change how these charts are displayed.
If you have finely tuned visualizations that depend on pixel precision, we recommend reviewing them. If you use automated screenshot tests, you may need to update those tests as well.
ClickHouse is now fully supported and out of beta! This data source is enabled by default for all users. See the ClickHouse section for more details.
Some identity providers do not support custom scopes or have limits on characters and length. To solve this, we introduced Customizable JIT Provisioning. This feature currently works alongside the original JIT, so you can continue using the previous version if needed.
Customizable JIT Provisioning is managed in the organization settings, giving you more control over its setup. Both custom scopes and user groups are optional. However, at this time, it only supports organizations with a single identity provider.
Improved Data Blending
We have made it easier to analyze and combine data from different sources. Now, you can create metrics that calculate summary values at the source level and use FlexQuery to perform final calculations like sum or difference, without loading data into a central data warehouse. This reduces the amount of data transferred, keeping it within platform limits. It’s especially useful for merging data from multiple regional data sources into one workspace.
The feature improvements include the following:
- Ranking Filters and Metric Value Filters now work with visualizations that use metrics from multiple sources.
- Show Missing Values is now supported.
- In the Analytics Designer metrics bucket, you can create cross-source metrics using
Sum,Difference,Product,Ratio, andChange. - In the current version, Show in % works only when breaking down by a single common (non-date) attribute across all federated metric sources.
Performance Improvements
We have improved the data blending feature to make it faster and more reliable. These improvements include a new check for mismatched data types, which helps prevent errors during runtime.
If you experience problems:
- Check your database tables to ensure data types are correct.
- Find and fix mismatched data types in dataset references or attribute/label definitions.
Columns referencing primary keys should share the same data type to ensure smooth and effective joins between datasets. For example, you should avoid mixing a numeric type column with a string column. This is essential for successful equi-joins and helps avoid potential failures or performance issues.
See the Blending Data section for more details.
GoodData.CN 3.29.0
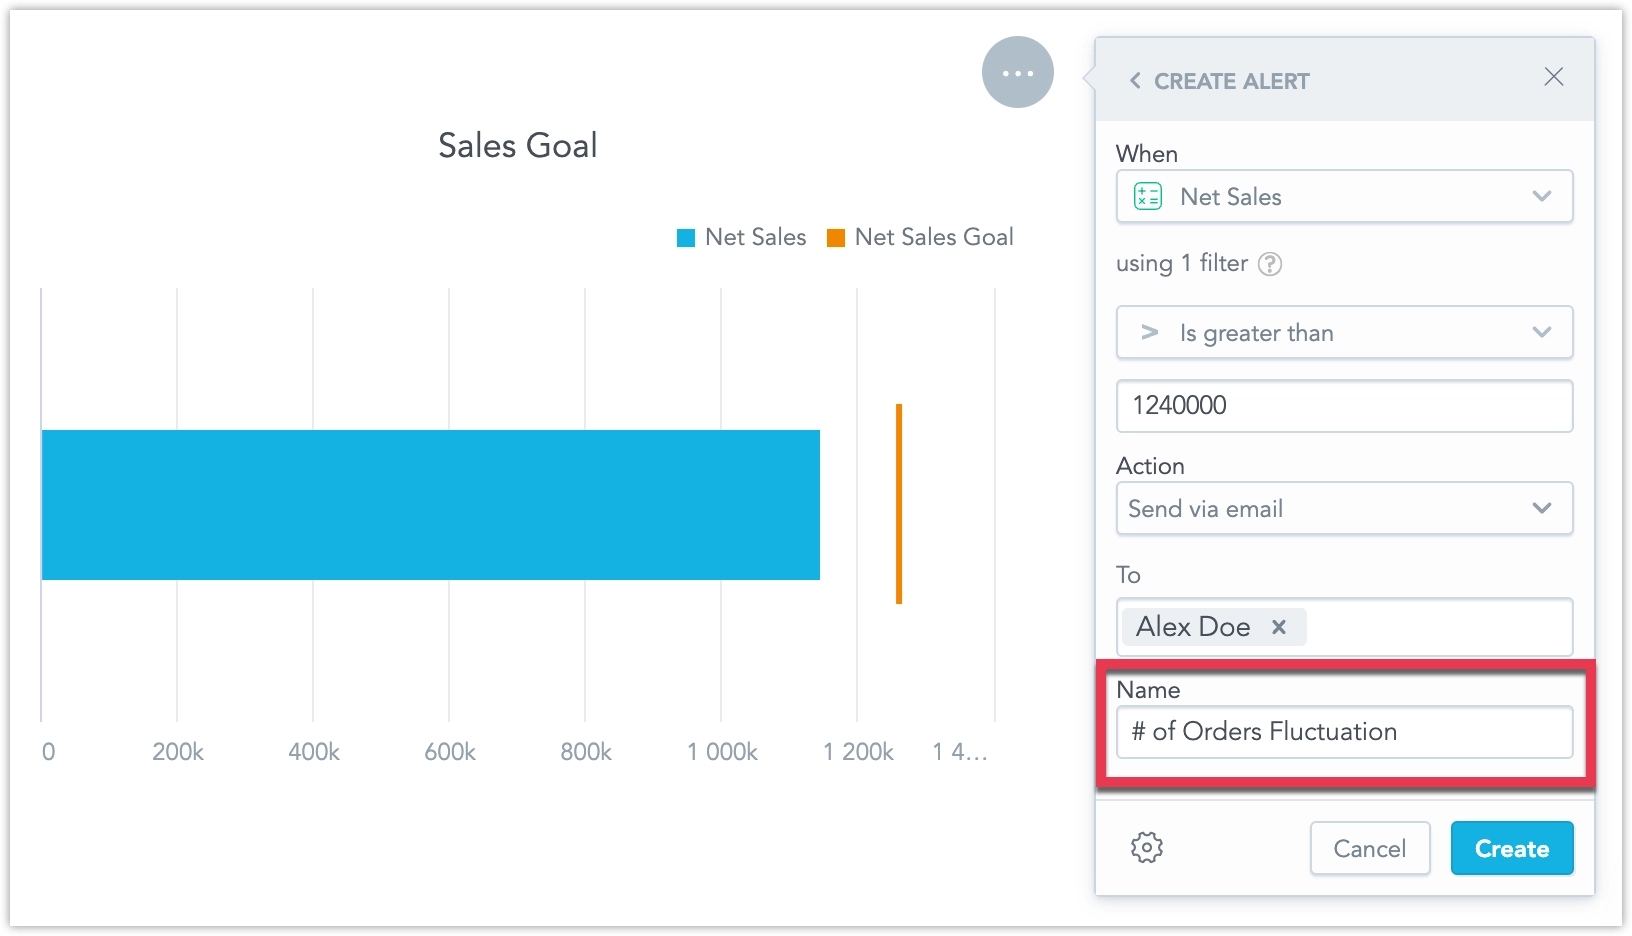
You can now assign custom names to alerts when creating or editing them, making it easier to recognize which of your alerts has been triggered, when reviewing alerts at a glance. See Create Alerts for details.
We plan to continue enhancing alert automations, including improvements to how filters are handled, in the coming weeks.
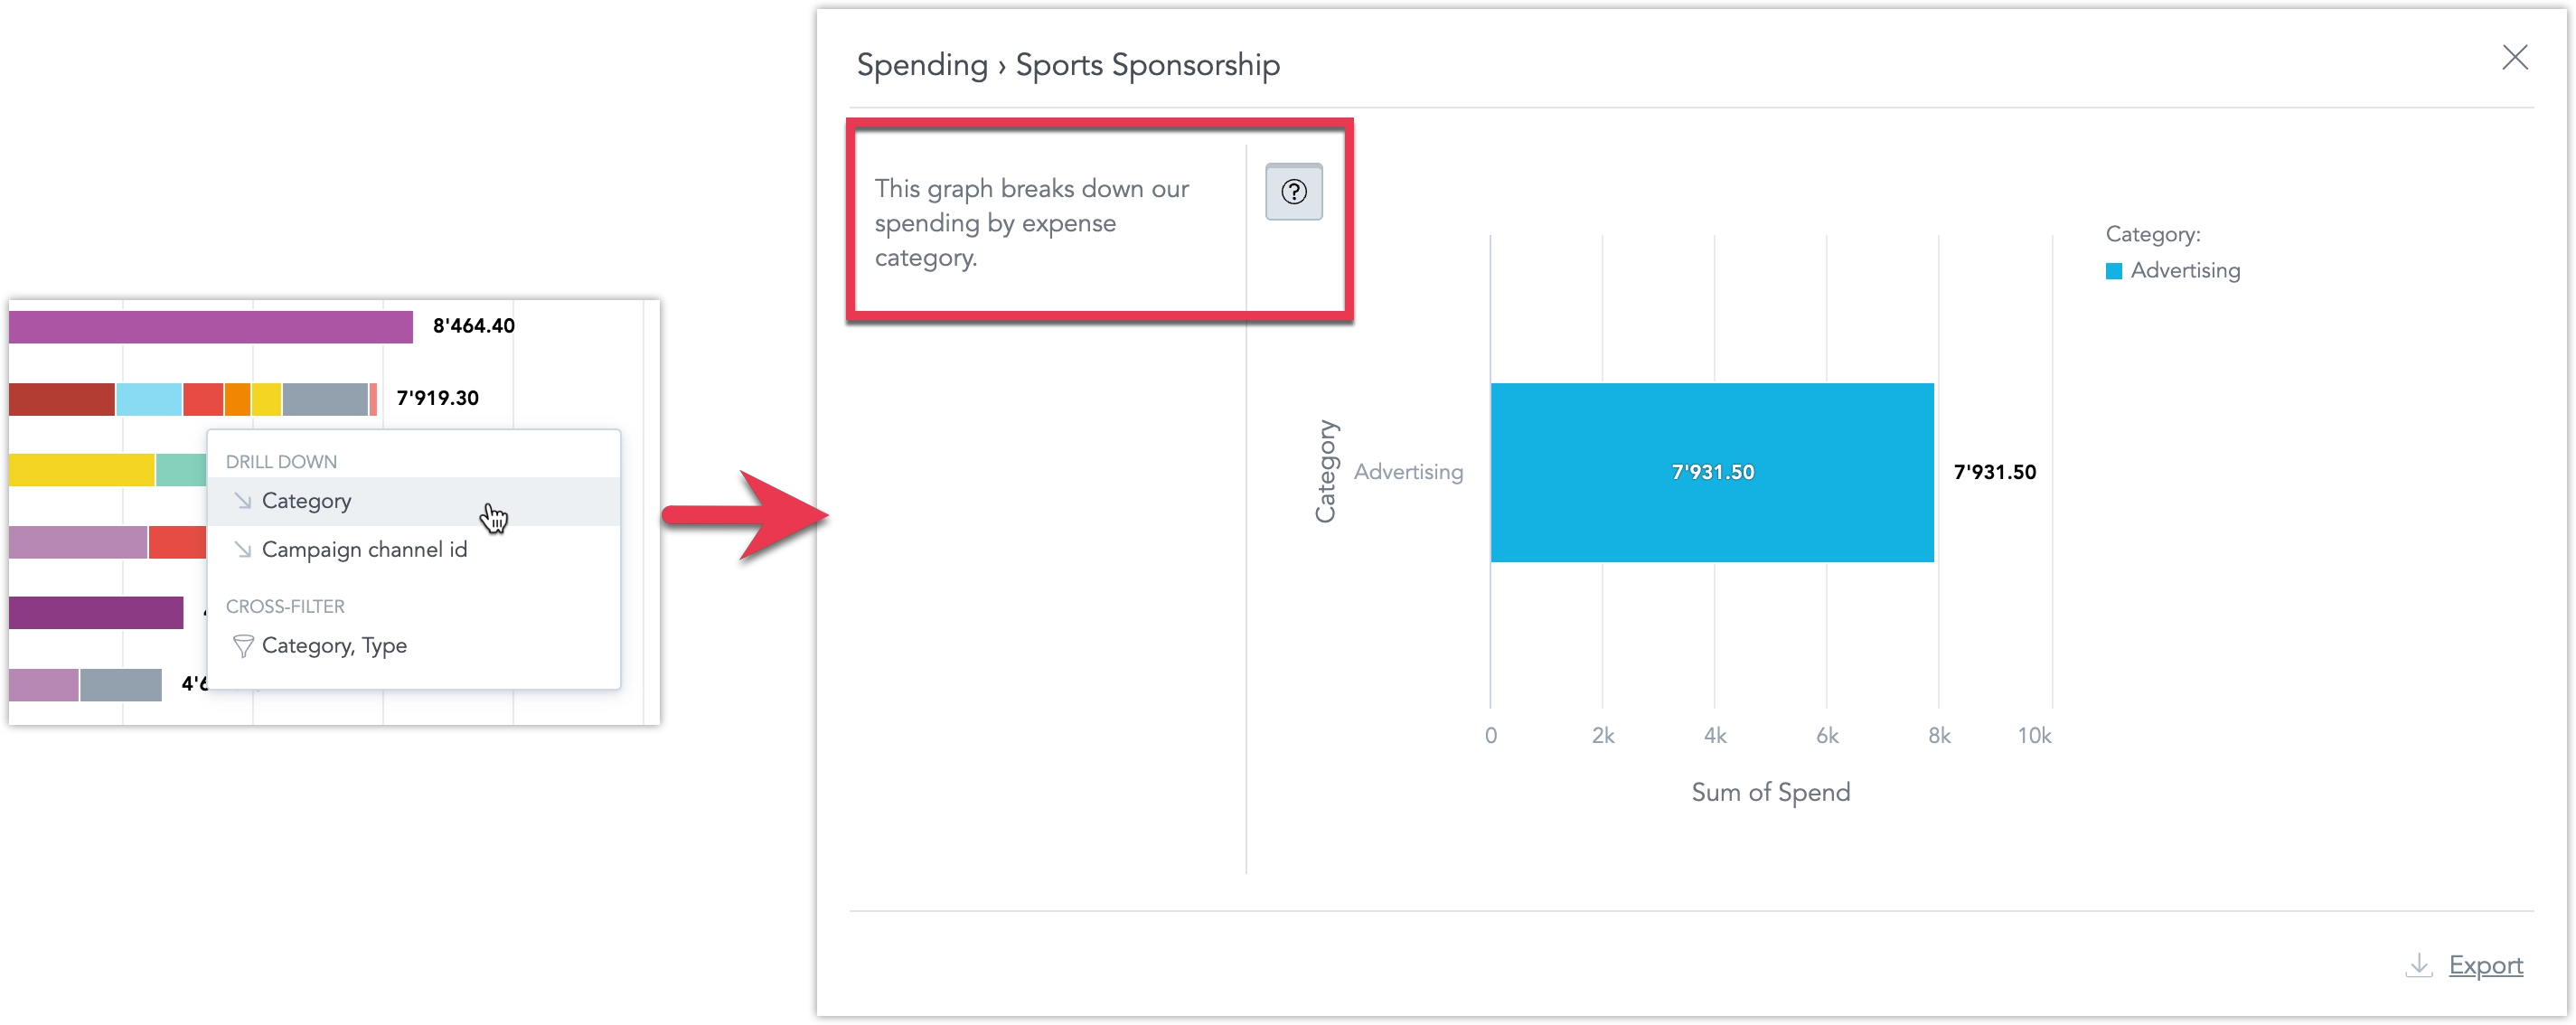
On the dashboard, when drilling down from one visualization into another, users can now view the description of the target visualization by clicking a new tooltip icon.
This feature was previously in beta and first became available in early access on January 8, 2025. It is now enabled by default for all users.
We have made it easier to analyze and combine data from different sources. Now, you can create metrics that calculate summary values at the source level and use FlexQuery to perform final calculations like sum or difference, without loading data into a central data warehouse. This reduces the amount of data transferred, keeping it within platform limits. It’s especially useful for merging data from multiple regional data sources into one workspace.
The feature improvements include the following:
- Ranking Filters and Metric Value Filters now work with visualizations that use metrics from multiple sources.
- Show Missing Values is now supported.
- In the Analytics Designer metrics bucket, you can create cross-source metrics using
Sum,Difference,Product,Ratio, andChange. - In the current version, Show in % works only when breaking down by a single common (non-date) attribute across all federated metric sources.
See the Blending Data section for more details.
You can now manage data separation directly in the GUI. This feature visually represents the functionality of Workspace Data Filters (WDF), which are useful for creating workspace hierarchies and multitenant environments.
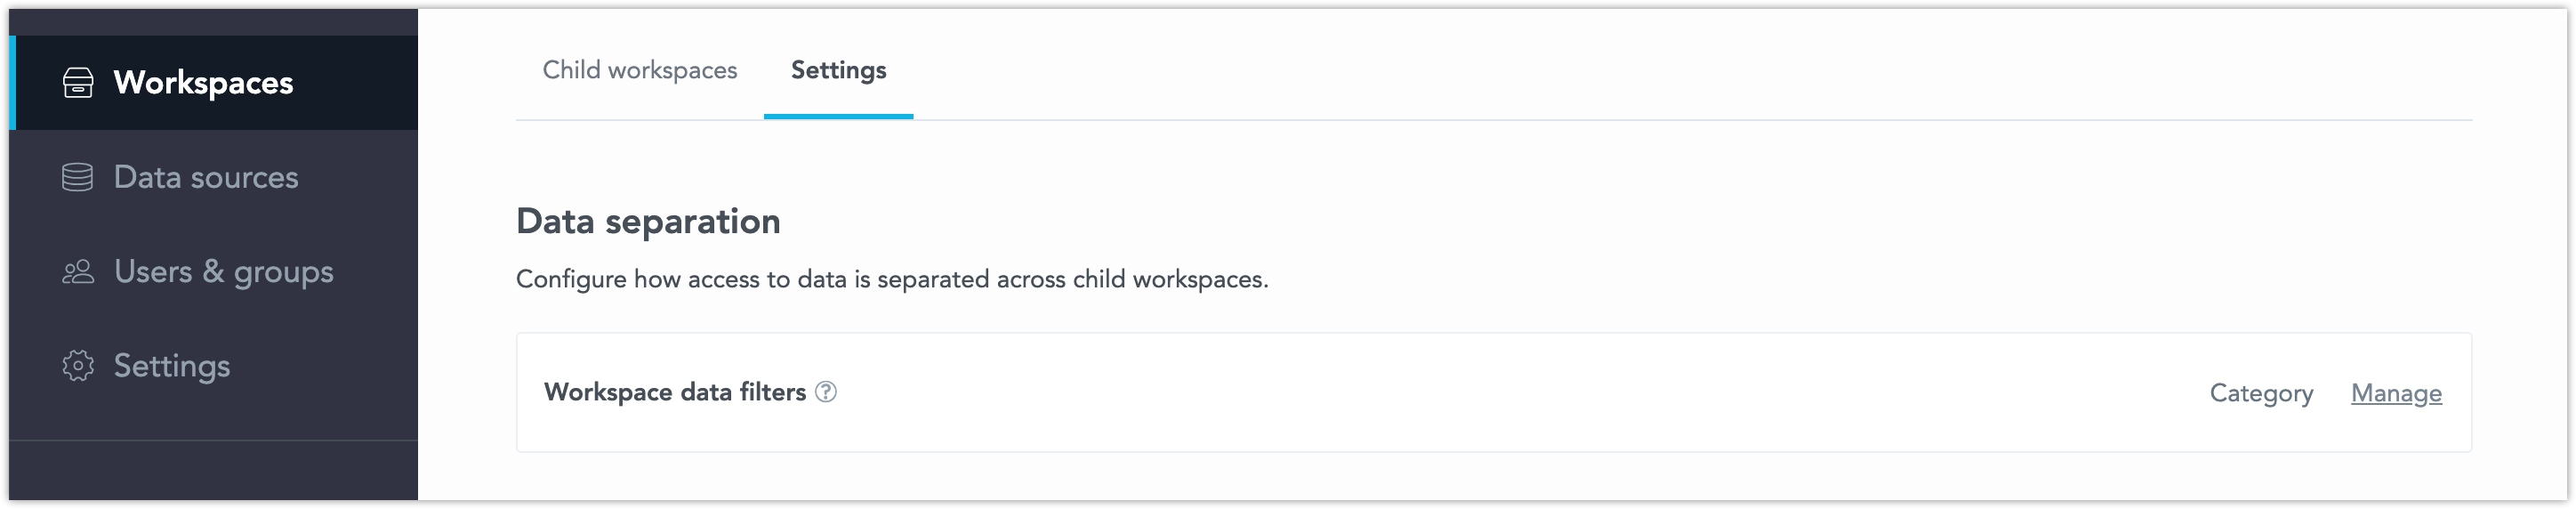
WDFs allow you to restrict data available in child workspaces. For example:
- A parent workspace may display data from all company departments.
- A child workspace, with a WDF applied, will only see data for the Sales department in the same visualization.
You can now manage workspace settings directly in the GUI. This update allows you to:
- Create workspace data filters
- Change the workspace’s color theme and palette
- Adjust localization settings
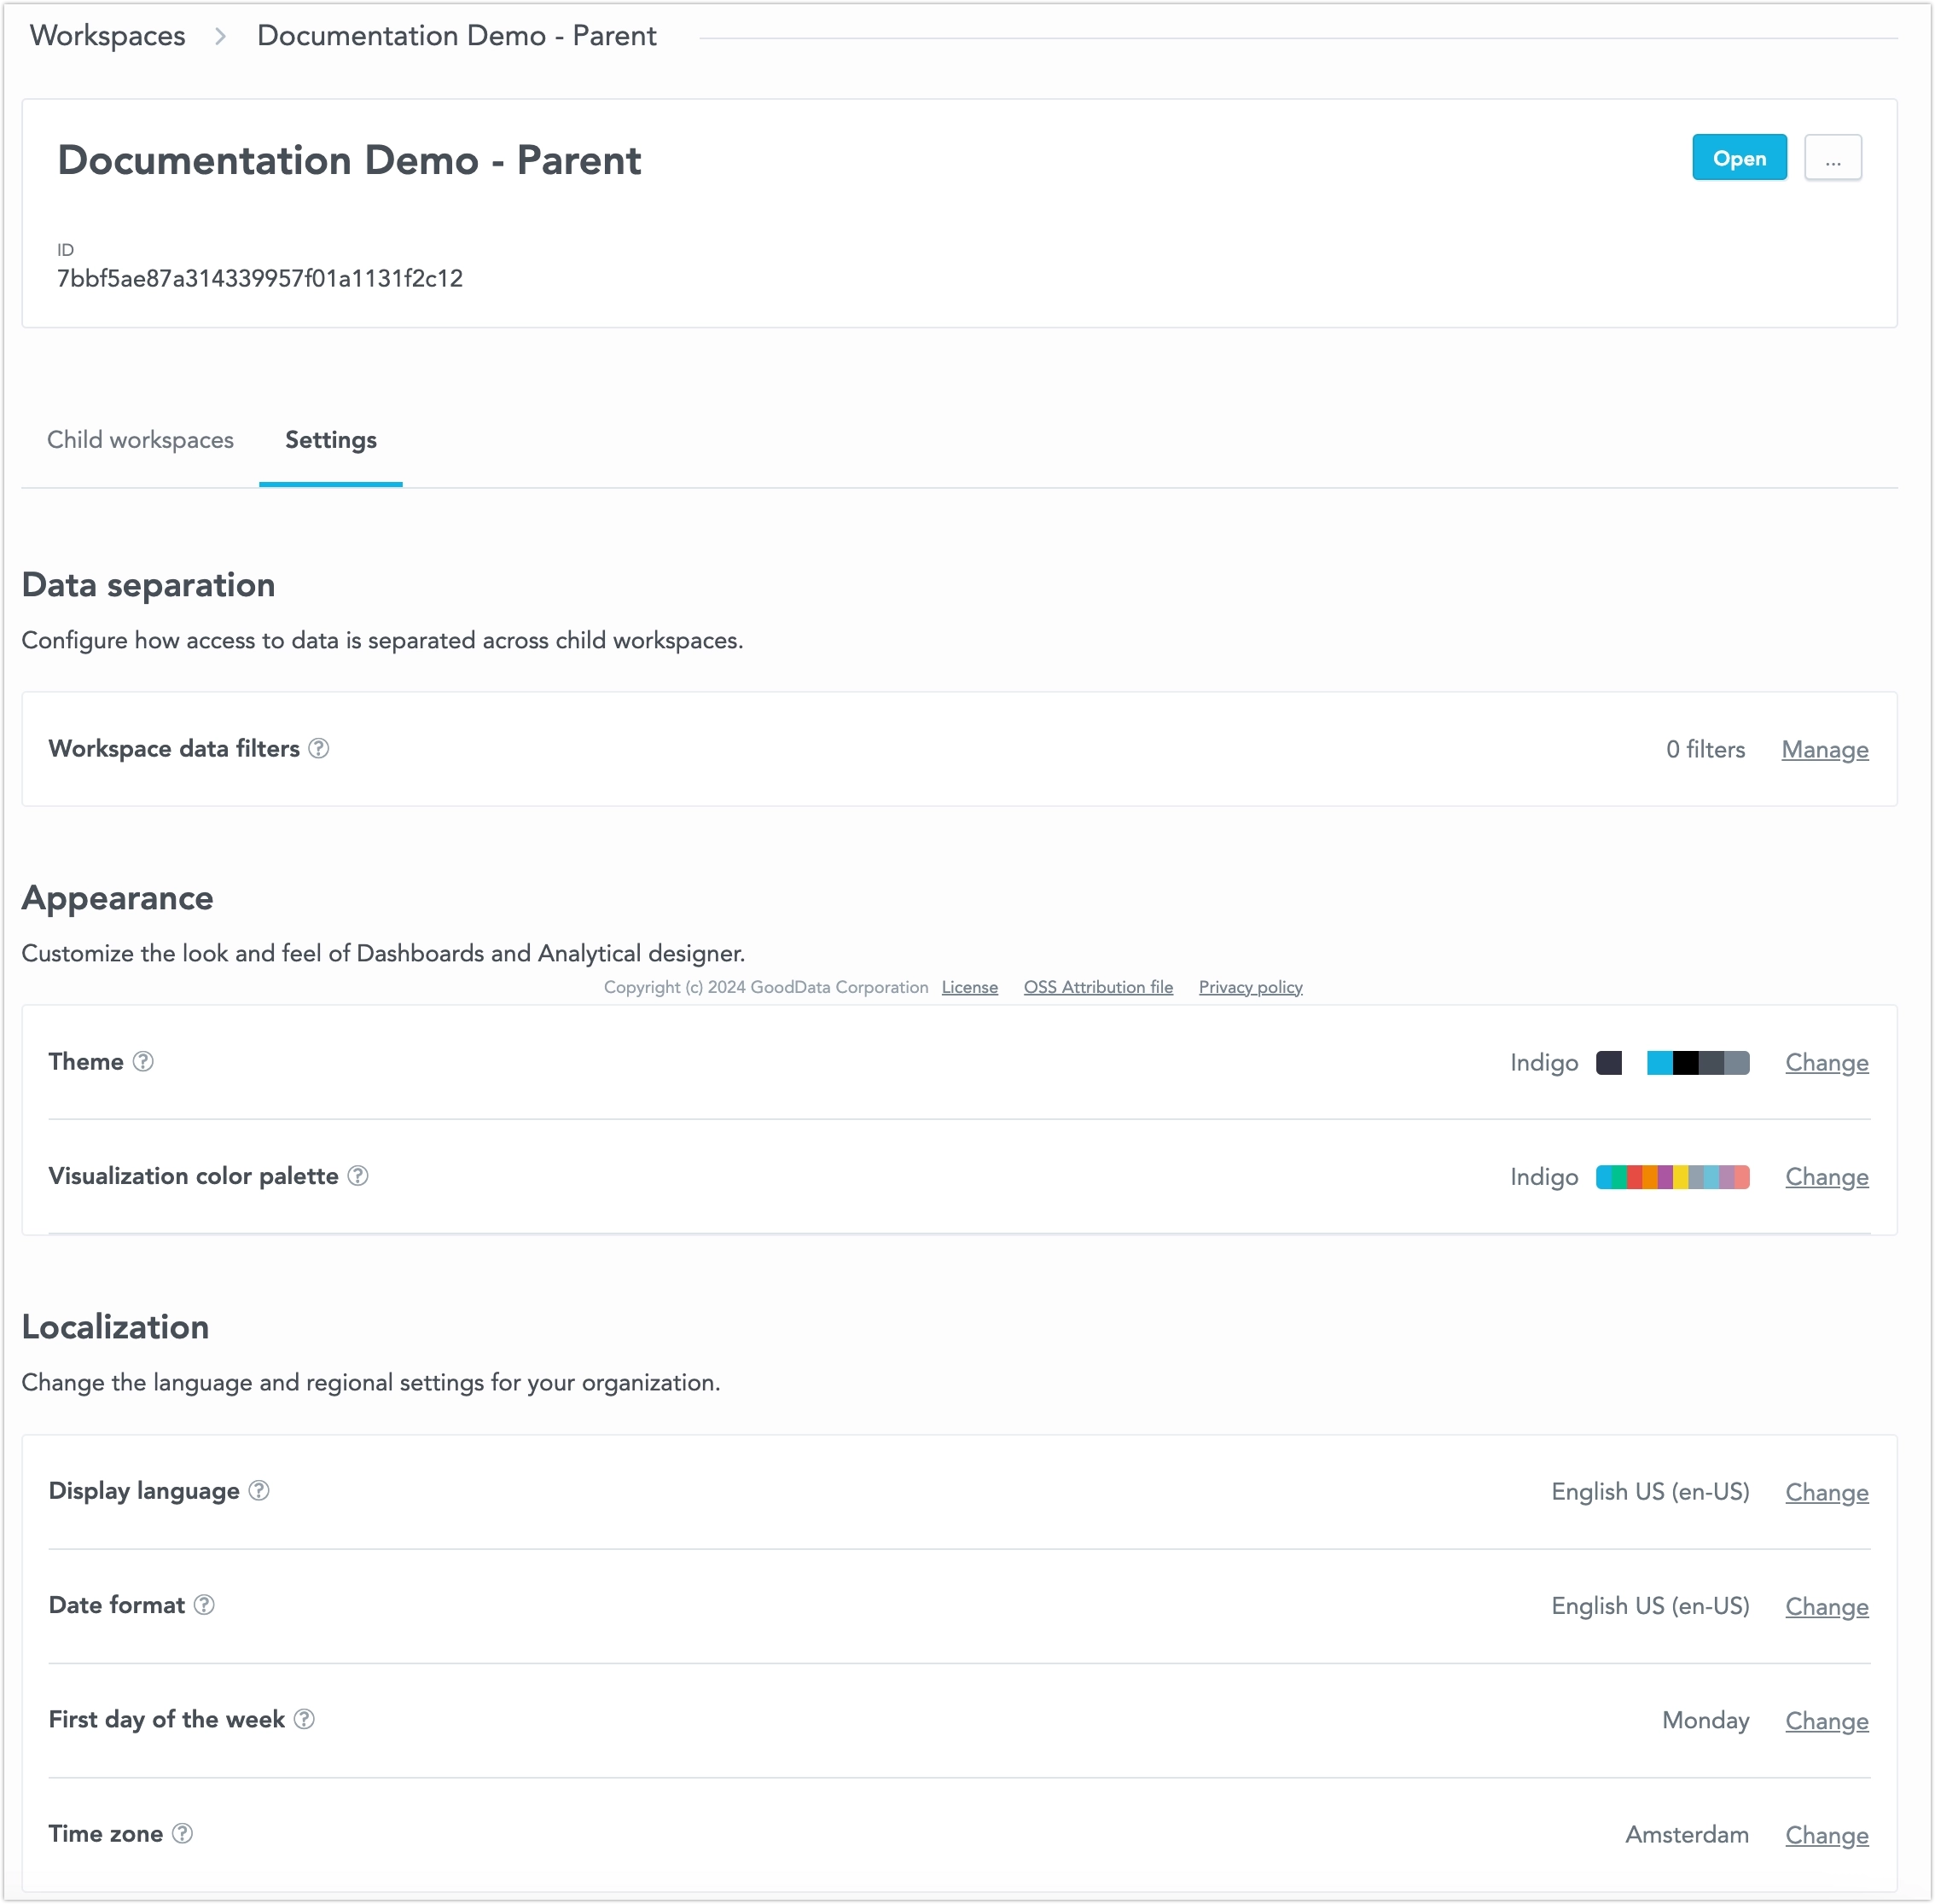
All these changes can now be made without using the API. For further information, see the Workspace Settings section.
GoodData.CN 3.28.0
PostgreSQL Data Source SSL Validation
When setting up a PostgreSQL data source, the API/backend now requires at least one of the ssl or sslmode parameters.
Changes to Existing Data Sources
If your data source does not include ssl or sslmode in the JDBC URL, we will automatically add sslmode=prefer to keep things working as they are now. This ensures no breaking changes, as it was the previous default for the PostgreSQL driver.
However, we recommend switching to sslmode=verify-full for better security and to ensure encryption in transit protection.
Changes for New Data Sources
When creating a new data source via API, you must now include either ssl or sslmode in your request.
If you’re using a template to create data sources automatically, you need to update the template to include one of these parameters.
If not, the new data source creation will fail, which is different from how it worked before.
GoodData.CN 3.27.0
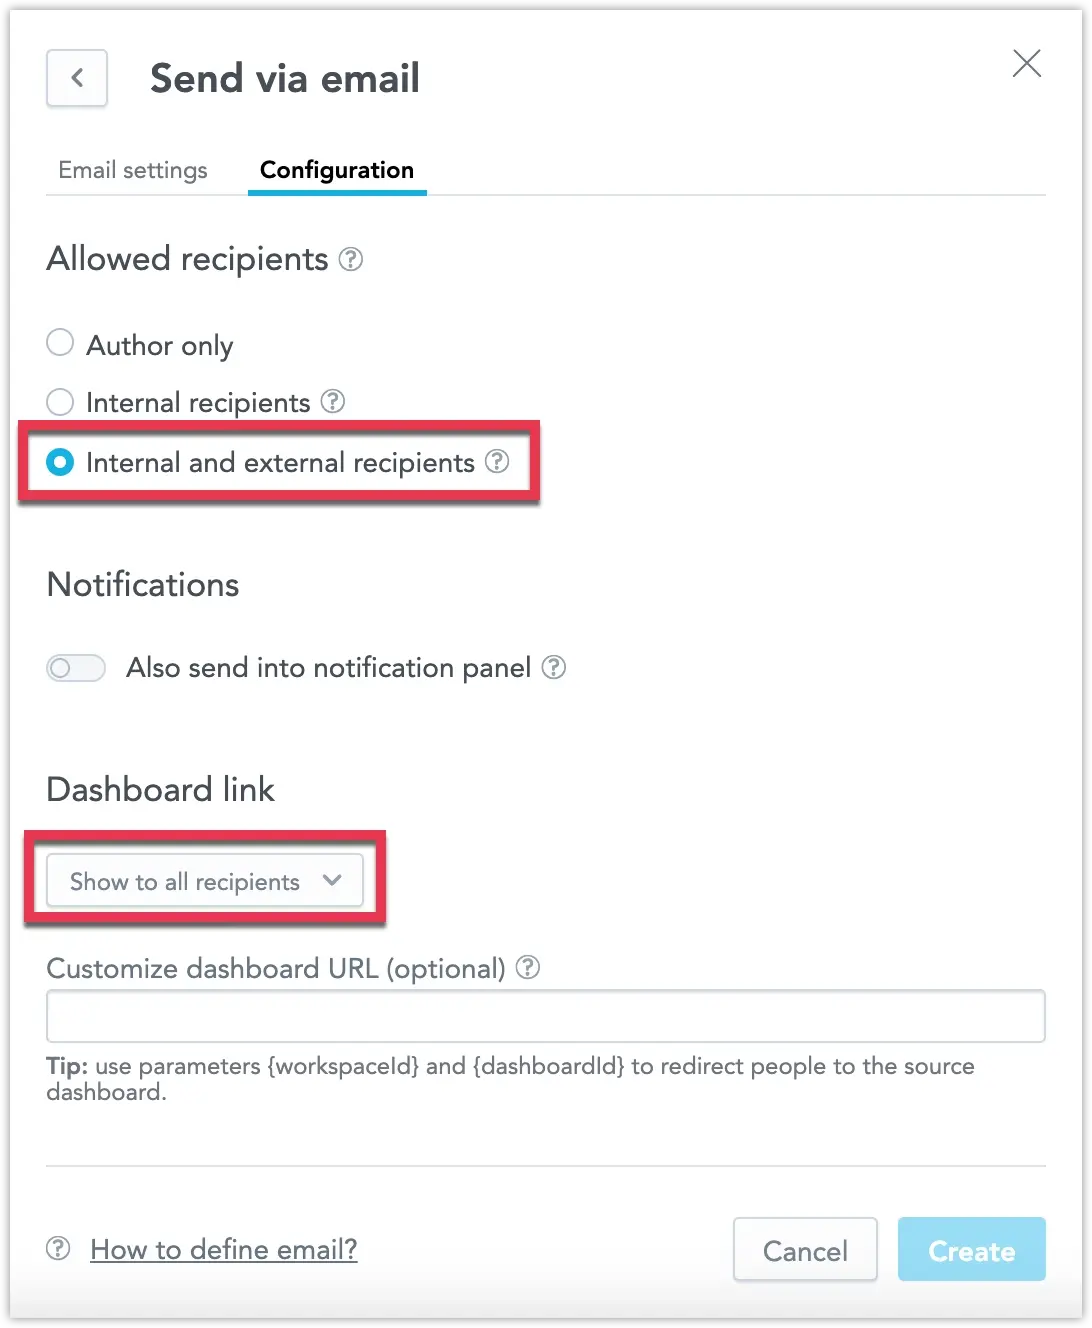
Administrators can now configure destinations that allow users to send alerts and scheduled exports to any email address, including those outside of your organization. For added control, you can disable the inclusion of dashboard links when sending to external recipients. See Create Destinations for details.
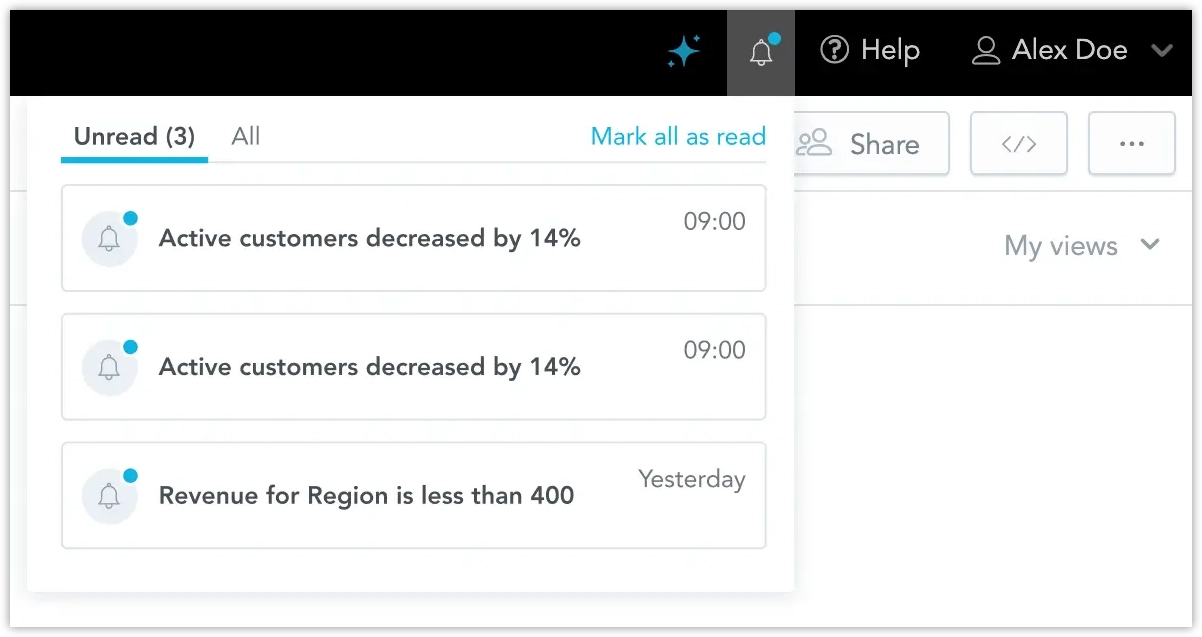
In addition to receiving automatically triggered alerts via email and webhook channels, you can now also send alerts to a new notification panel. Located at the top of the web application, the notification panel is accessible from anywhere within the workspace. By clicking a notification, you can navigate directly to the widget that triggered the alert.
Notifications can be sent independently or alongside email and webhook alerts. See Create Destinations for details.
PostgreSQL Data Source SSL Validation
When setting up a PostgreSQL data source, the API/backend now requires at least one of the ssl or sslmode parameters.
Changes to Existing Data Sources
If your data source does not include ssl or sslmode in the JDBC URL, we will automatically add sslmode=prefer to keep things working as they are now. This ensures no breaking changes, as it was the previous default for the PostgreSQL driver.
However, we recommend switching to sslmode=verify-full for better security and to ensure encryption in transit protection.
Changes for New Data Sources
When creating a new data source via API, you must now include either ssl or sslmode in your request.
If you’re using a template to create data sources automatically, you need to update the template to include one of these parameters.
If not, the new data source creation will fail, which is different from how it worked before.
You can now customize the date filters in your dashboard to show specific time granularities, such as only days, months, or years. This is done using the dateFilterConfig metadata object in the GoodData UI. This feature allows you to optimize your dashboards by displaying only the date increments that are most relevant to your use case.
For more details, see the Date Filter Documentation.
GoodData.CN 3.26.0
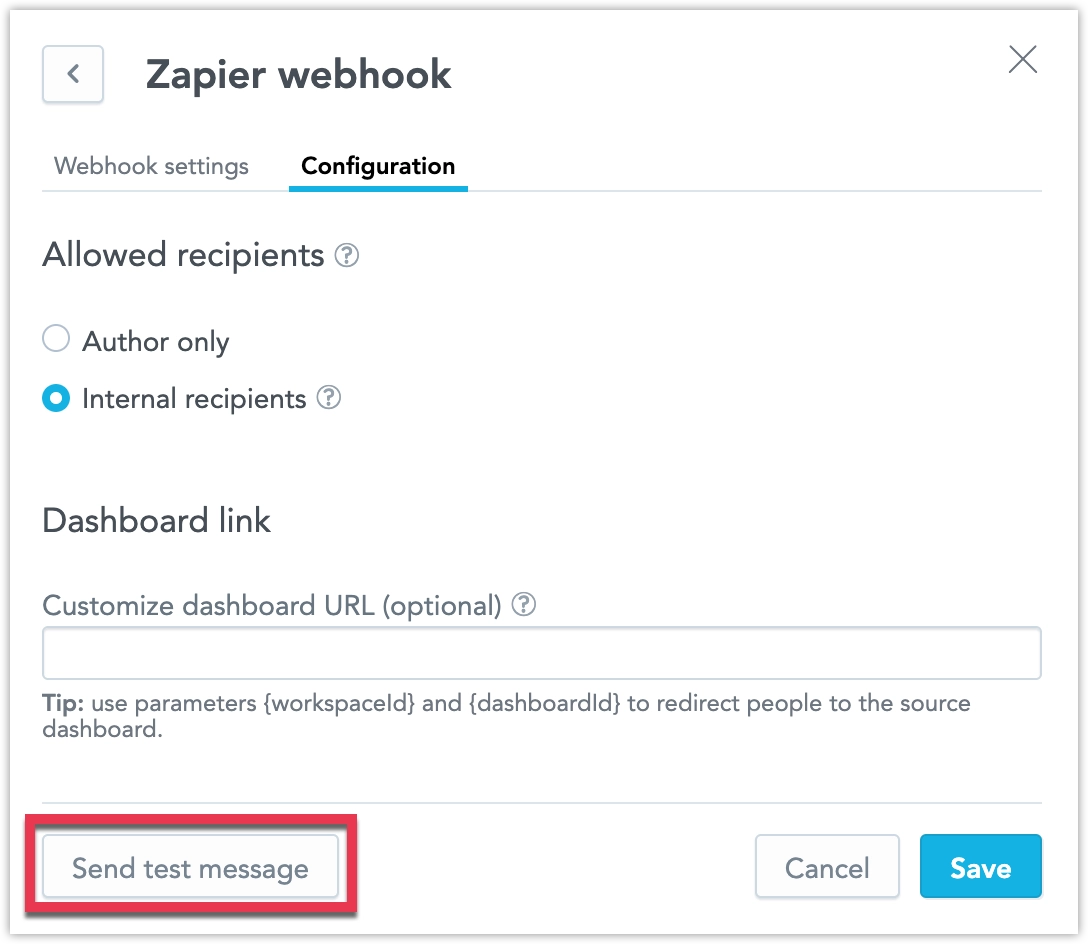
Administrators can now edit a destination and test the connection to their webhook or SMTP server using the new Send test message button. This protocol is also initiated whenever you create and attempt to save a new destination, ensuring that all new destinations are automatically validated before they can be used.
On the dashboard, when drilling down from one visualization into another, users can now view the description of the target visualization by clicking a new tooltip icon.
In response to frequent feedback, we have removed users with organization.MANAGE permissions from the list of recipients in the automation dialog. If your solution requires sharing automations with these users, please ensure they are assigned explicit workspace permissions. This allows you to control which workspaces include admins as recipients and which do not.
GoodData.CN 3.25.0
We are excited to announce the release of the Blending Data feature. This capability lets you create visualizations using metrics computed from multiple data sources. By blending data into a single result set using common conformed dimension attributes, you can now perform more flexible and powerful cross-source analysis. See the Blending Data section for more information.
GoodData.CN 3.24.1
We are introducing M2M as a new authentication method to connect Databricks as a data source. We will also remove the option to use basic authentication with this data source by the end of January 2025, as it is no longer supported by Databricks.
See the Databricks section for more information.
We resolved an issue where certain API usage scenarios could unexpectedly disable some workspace data filters. This hotfix mitigates the risk of unintended disablement and ensures the expected behavior of workspace data filters moving forward.
GoodData.CN 3.24
You can now make visualizations smaller, giving you more freedom to design dashboards your way. The minimum width for visualizations is now 2, except for geocharts, which still have a minimum width of 6 due to technical reasons.
Companies often have data spread across many sources, and with so many types of data storage, it’s hard to support all combinations with regular data connectors. FlexConnect helps solve this by letting you connect to almost any data source. This includes streaming data, structured and unstructured data, databases, third-party platforms, and machine learning models.
Previously, we used the names “FlexFunctions” and “Flight RPC” during the beta phase. The new name, “FlexConnect,” makes everything consistent in the user interface, repository, and API (which still used “FLIGHTRPC” before).
See the FlexConnect page for more information.
GoodData.CN 3.23
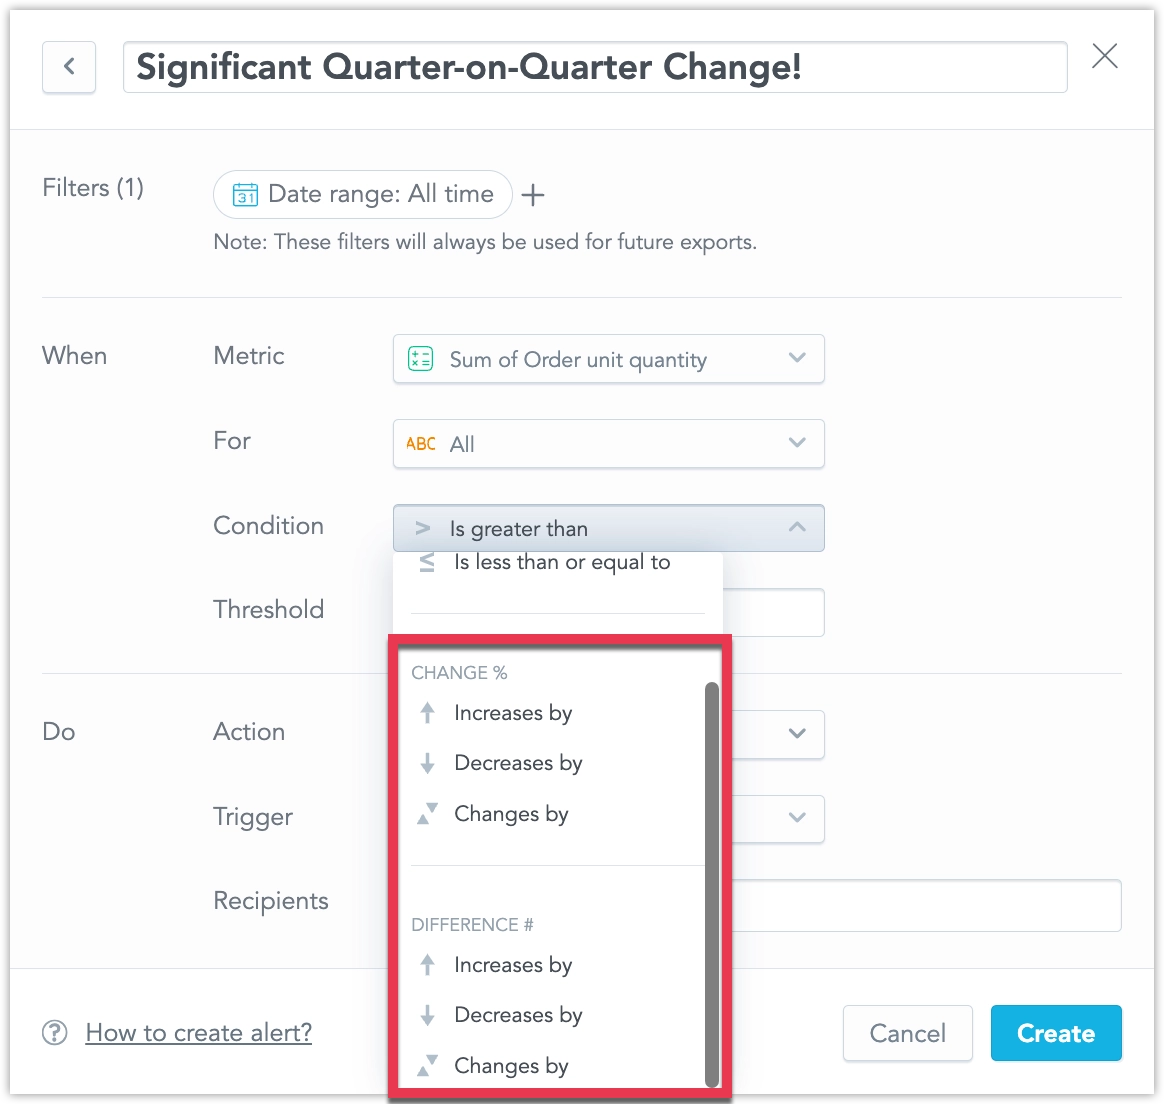
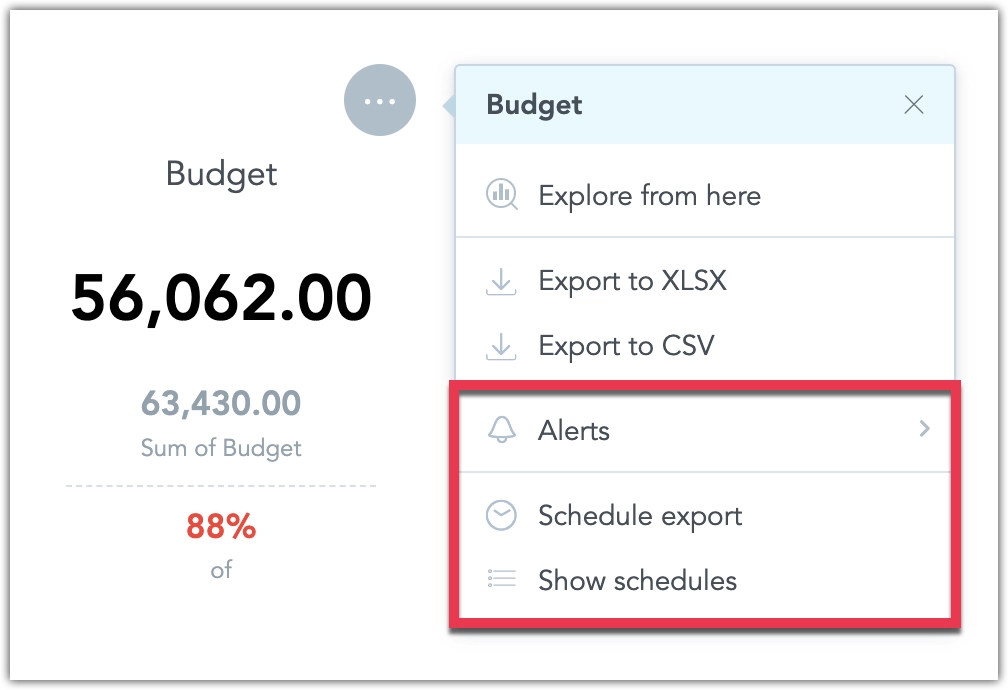
You can now create alerts that track metric changes compared to previous periods, helping you identify trends over time. With the new period comparison options, you can set alerts for relative (percentage) or absolute changes, or compare the current period to the same period last year for seasonal insights. See Create Alerts for details.
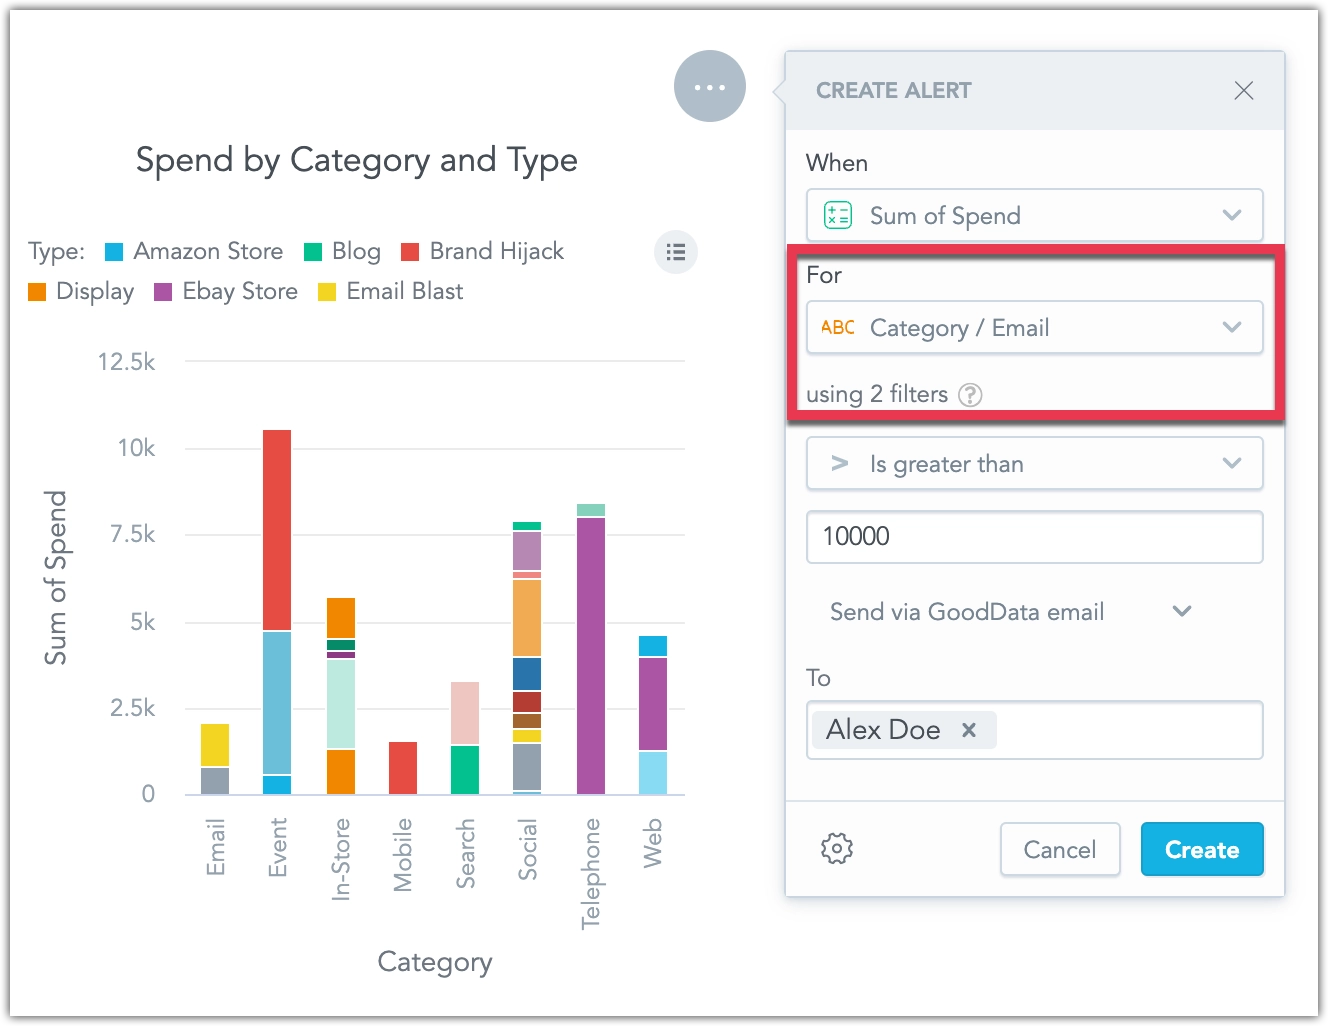
You can now create alerts for individual attributes, enabling you to set up multiple alerts for a single metric based on different values of an attribute. For example, you can break down an alert for a budget metric into multiple alerts, one for each category of spending. See Create Alerts for details.
GoodData.CN 3.21
We have expanded the Users & groups web interface to support full workspace permission management, including permissions previously available only through the API. Now, you can manage all user and user group permissions directly from the web interface, streamlining access control for your workspace.
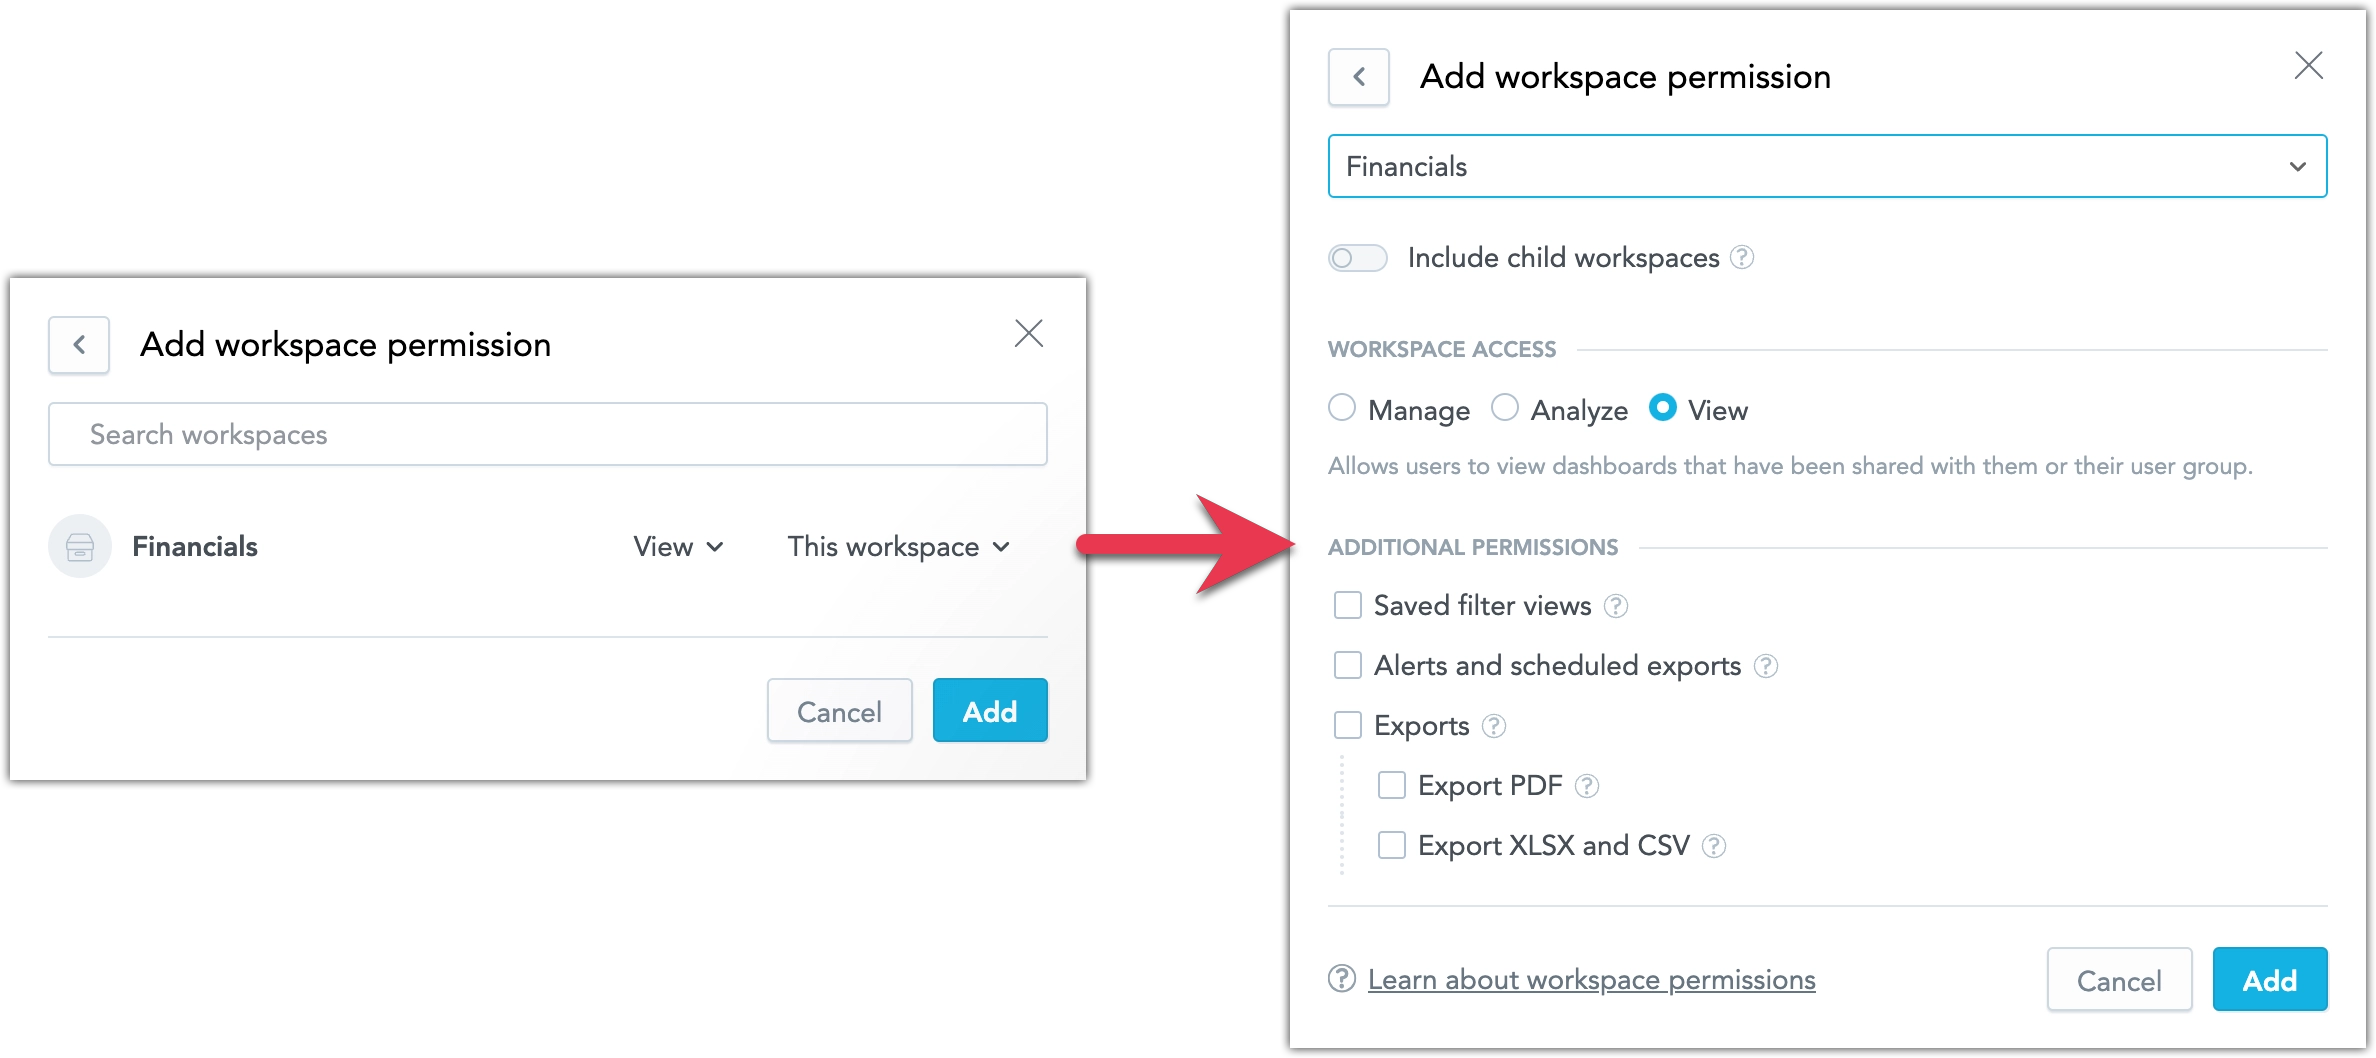
For more information on workspace permissions, see Manage Workspace Permissions.
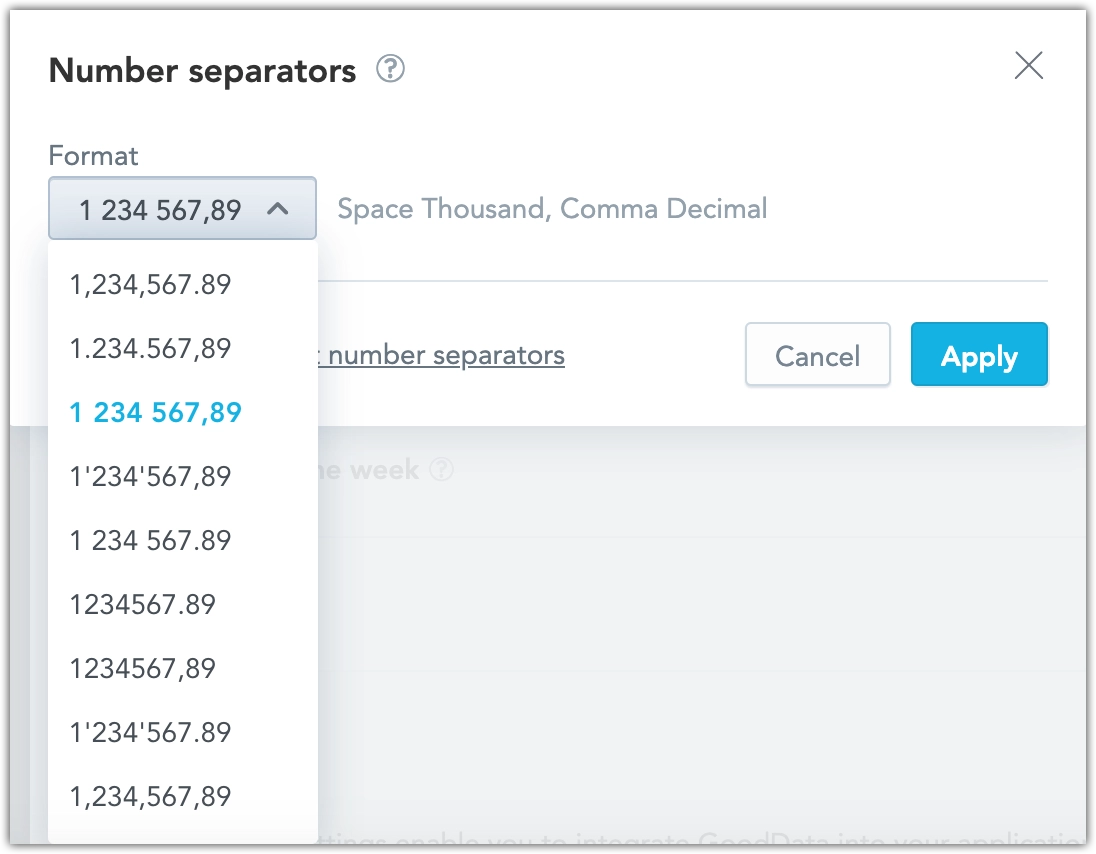
We have added a Number separators option under Settings > Localization to support various numeric formats across languages. This feature allows you to apply region-specific number formats, such as European standards.
Attribute filters now utilize the primary unique label in the backend while displaying objects using their secondary label in the interface. This update allows for more precise filtering, showing separate entries for objects with identical secondary labels (e.g., two users named “John Doe”). See the Object Labels and Filters section for more details.
We are delivering a bug fix that changes how column names behave in repeater visualizations. Previously, column names were incorrectly based on attribute label names instead of those defined in the Analytical Designer. With this update, column names in repeater visualizations will now reflect the names set in the Analytical Designer.
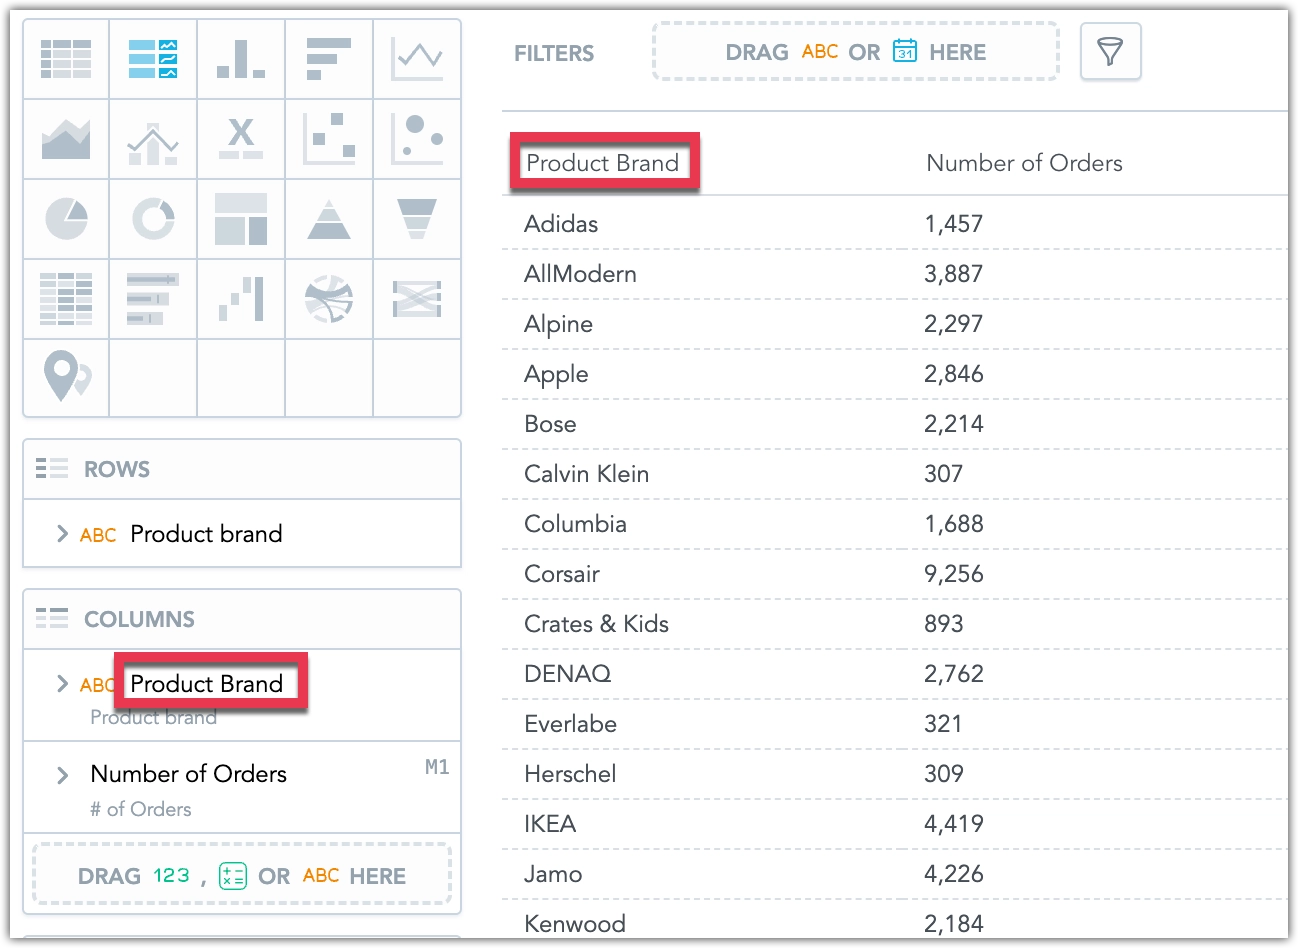
We recommend reviewing your existing repeater visualizations to ensure displayed column names appear as expected.
GoodData.CN 3.20
You can now automate key actions in dashboards, helping you stay on top of your data without manual effort:
- Alerts: Set up alerts on dashboard widgets to monitor metrics and get notified when specific conditions are met.
- Scheduled Exports: Schedule regular exports of dashboards and dashboard widgets to receive them as PDF, CSV, or XLSX files.
Both features offer flexible delivery options, including integration with external systems via email or webhooks. Webhook payloads can be customized to support advanced workflows and automation. Initial setup by your organization’s admin is required to start using these features. See Automation in Dashboards for more details.
We have enhanced the layout options in our dashboards by introducing the ability to combine multiple visualizations into a single widget, allowing users to switch between them seamlessly. This feature helps improve dashboard readability, optimizes space, and enhances interactivity and usability for end users.
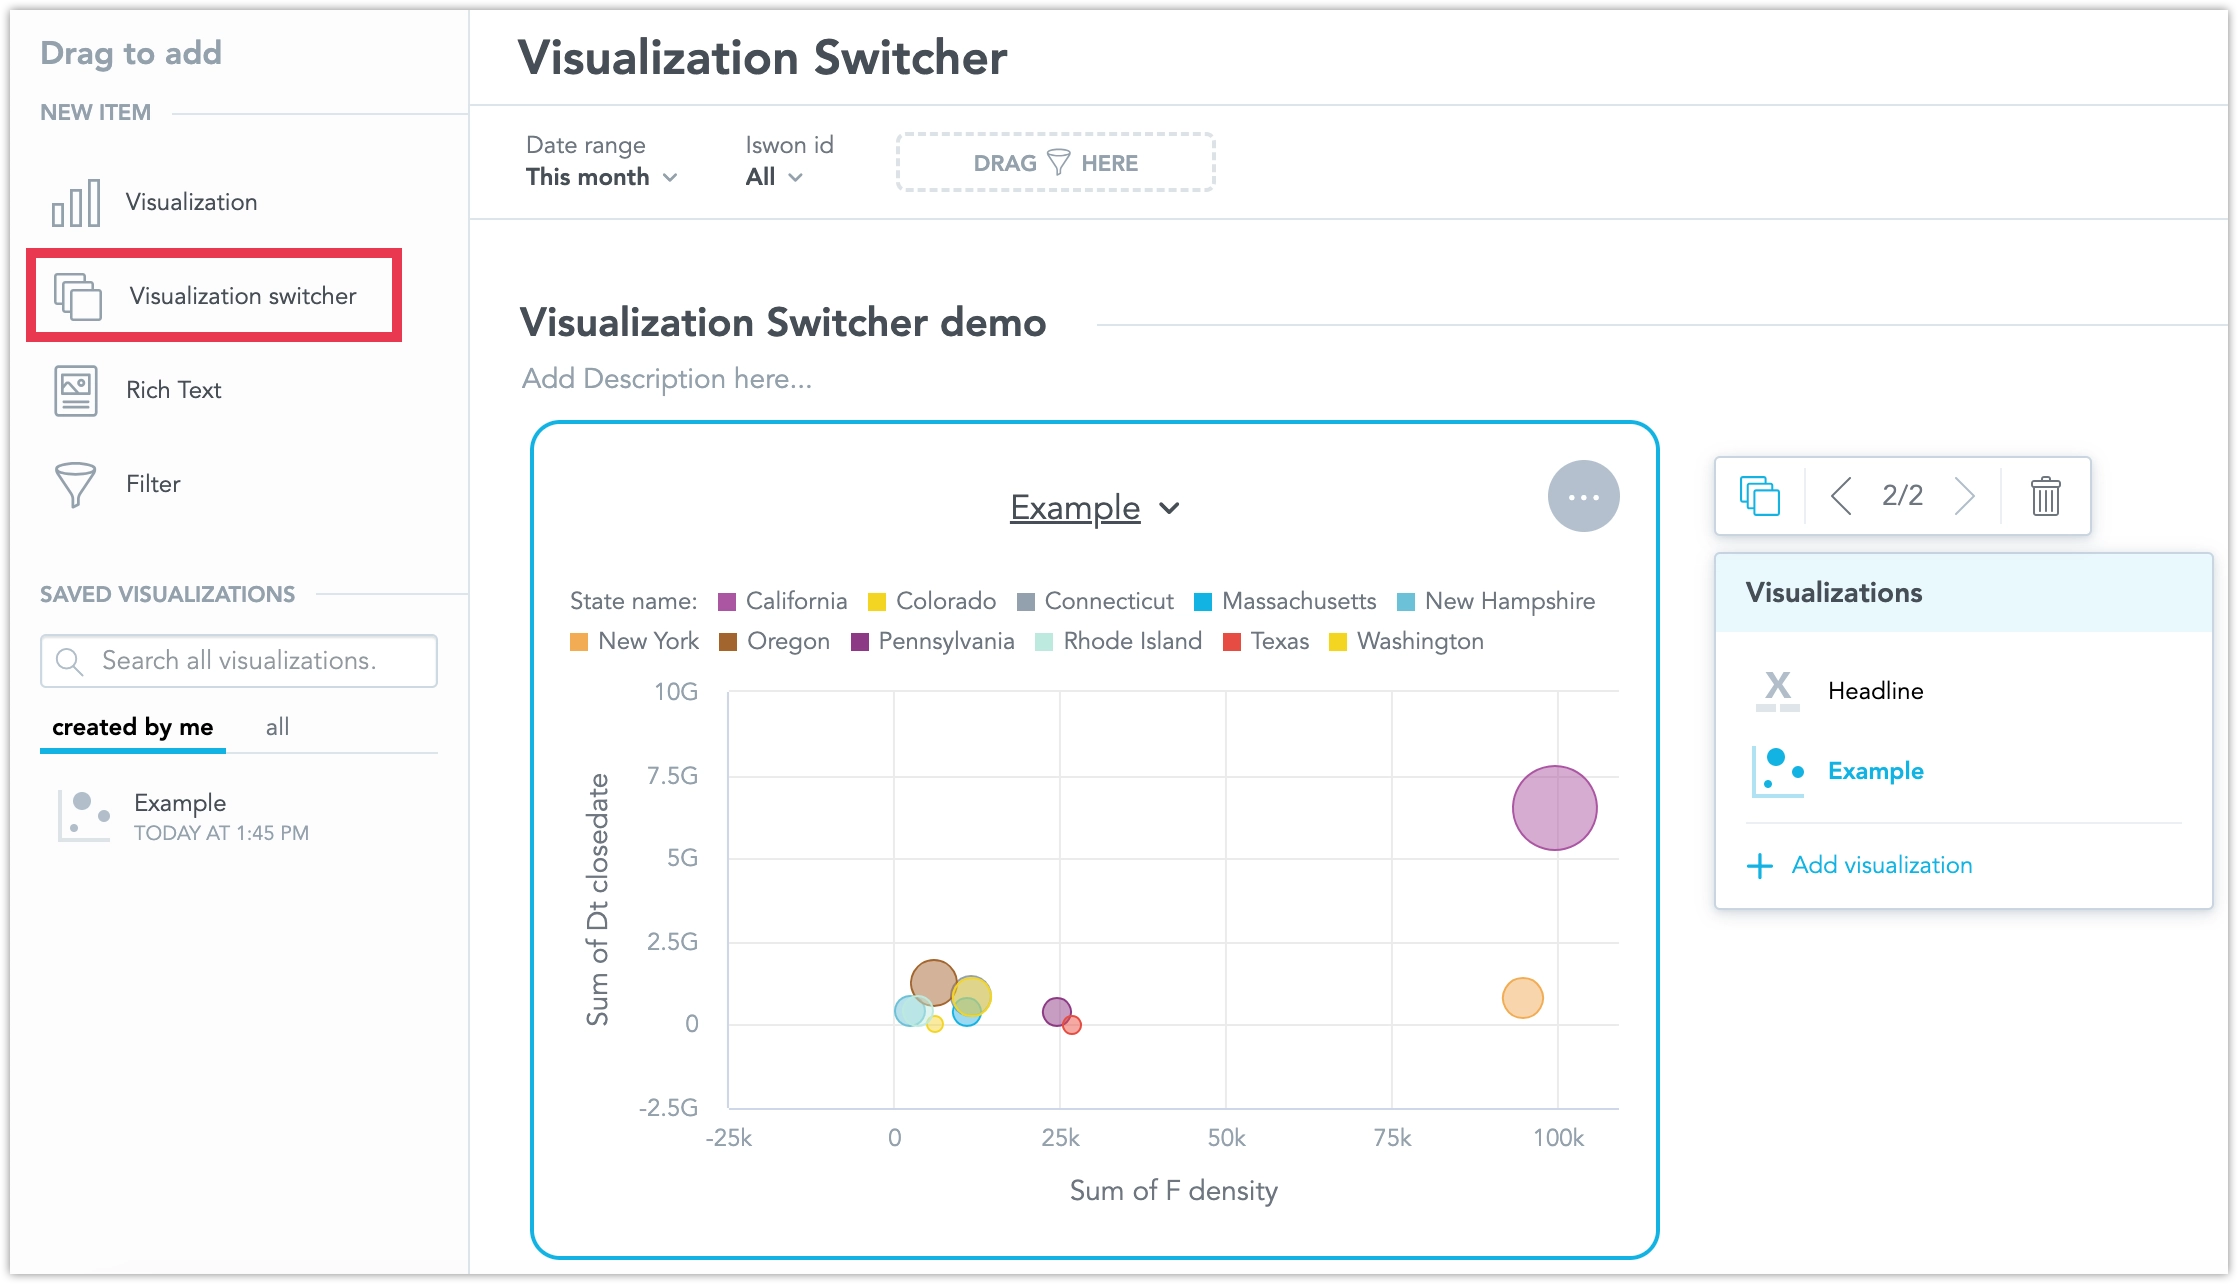
See the Visualization Switcher section for more details.
We would like to inform you about a bug fix coming on November 4, 2024, regarding column renaming in repeater visualizations. Previously, column names were incorrectly based on label names instead of the names set in the Analytical Designer. Starting on this date, all columns in Repeaters will reflect the names defined in the Analytical Designer.
To ensure a seamless transition, we recommend you review and update your column names in the Analytical Designer as needed before November 4, 2024.
GoodData.CN 3.19
We have added a new feature that lets you easily load filters you often use on a dashboard. Now, you can save these filter combinations and quickly switch between them with just one click.
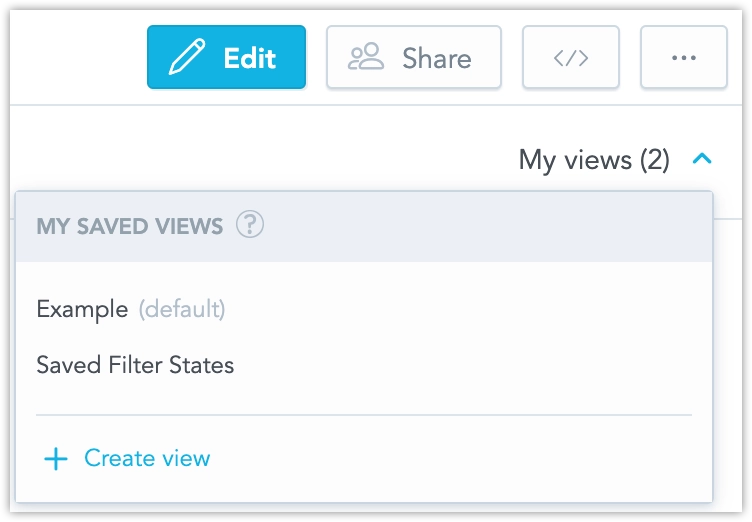
Additionally, we have added a new workspace permission that extends the VIEW permission, allowing users to save filters. This permission, called CREATE_FILTER_VIEW (or SAVE VIEWS in the GUI), must be applied alongside the VIEW permission. Users with ANALYZE or MANAGE permissions can save filters without needing any additional permissions.
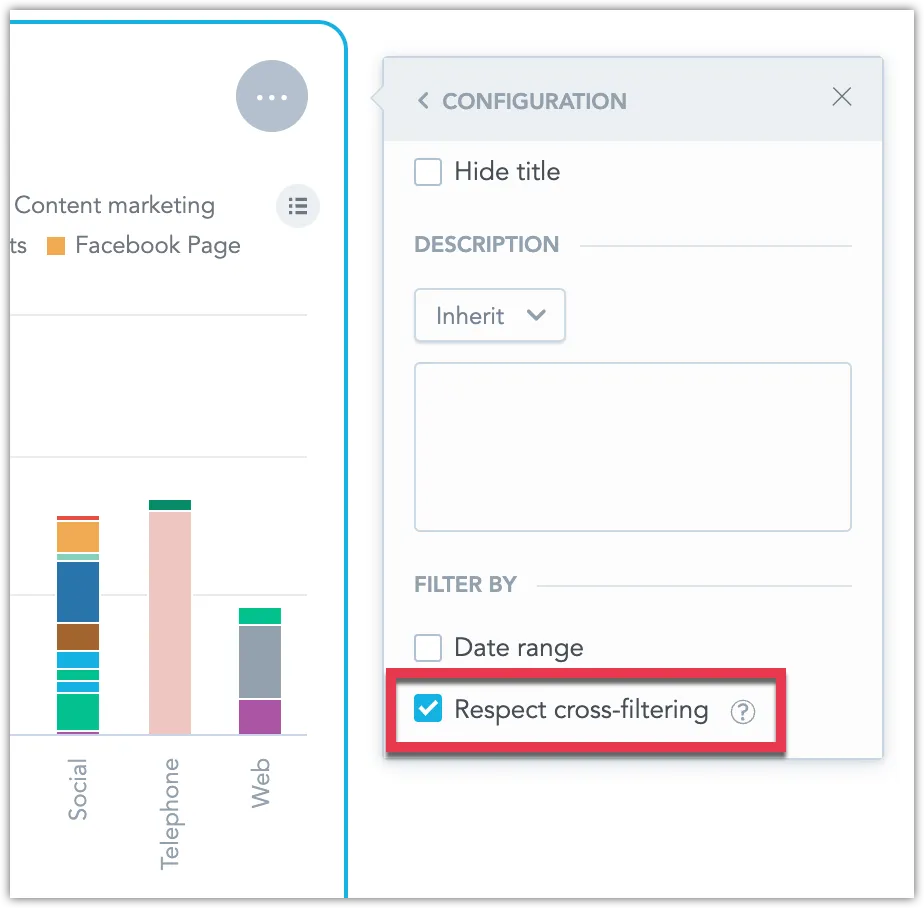
You can now disable cross-filtering for individual widgets on a dashboard. This allows for more tailored control over the behavior of specific widgets when crossfiltering is applied across a dashboard. See Cross-filtering for details.
GoodData.CN 3.17
New Language Support
We have expanded the language options for our user interface to include Australian English, Cantonese and Traditional Chinese, and Finnish. These languages are now fully supported in the Analytics Designer, Dashboards, and Metric Editor.
The newest version of GoodData.UI contains the following change:
You can now exclude specific attributes from the drill-down intersection. To configure this, use the addDrillDownForInsightWidget and modifyDrillDownForInsightWidget commands. Be aware that this may introduce breaking changes.
GoodData.CN 3.16
We are introducing a new type of total that aligns with the metric it aggregates. For example, if the metric is SUM, the rollup will also use SUM, and so on.
Rollup totals are “smart” aggregations. They are particularly useful for tables displaying metrics that represent average values, helping to avoid aggregations like averages of averages.
Example:
Won Metric: The rollup represents the sum of all regions’ won amounts, making the
SumandRollup (Total)equal.Avg. Won Metric: Instead of averaging the row’s values (which are already averages), the rollup averages the original underlying data before it was aggregated by the Won metric and divided into regions like East Coast and West Coast. Consequently, the value of
Avg(an average of averages) differs from theRollup (Total)average (an average based on the original data).
See Rollup Totals for details.
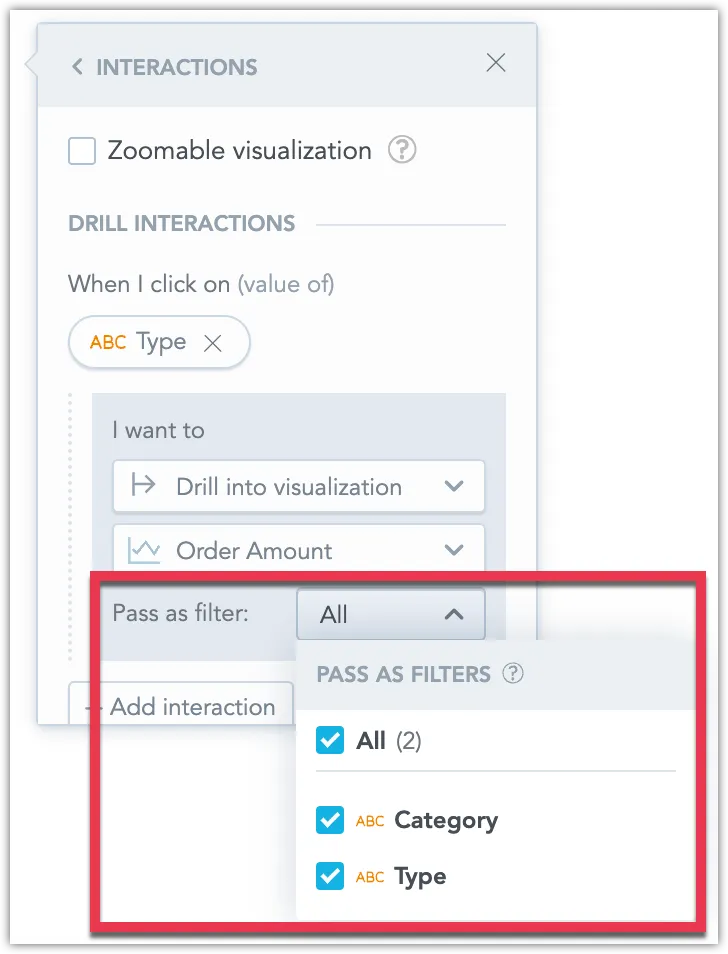
You can now choose to exclude certain dates or attributes from being applied as filters when drilling into visualizations, dashboards, or drill-downs. This allows for more flexible data exploration by controlling which filters are passed during drills. See Disable Passing Filters in Drill-Throughs for more details.
New version of the Python SDK is available today. Please note that in this version we have dropped support for Python version 3.8, please ensure your Python version is up to date if you update to this version of GoodData Python SDK. For details see the changelog.
We are going to update how attribute filters handle values with non-unique secondary labels, such as users sharing the same User Name.
Current Behavior:
When an attribute (e.g., User) has a unique primary label (e.g., User ID: 1234) and a more readable secondary label (e.g., User Name: John Doe), filtering by the User Name (if multiple users are named John Doe) results in all John Does being combined into a single filter value.
New Behavior:
The improved filter will display each attribute value even if the secondary label is not unique. This means you will see all instances of John Doe separately, with a tooltip showing the primary label (e.g., User ID) to help differentiate them. The filter’s behavior will be consistent across dashboards, visualizations, and drilling or exploring further interactions, regardless of which label is displayed.
This change is straightforward for end users. However, the metadata will have a new ‘Display as label’ parameter to indicate which label should represent the attribute in the GUI. This parameter must be considered when using filters in dashboards, visualizations, drilling, POST messages and events, SDK filter definitions, and cross-filtering. From now on, the filter will always be defined by the attribute’s primary label and values, which you should reflect when defining external filters (e.g., in POST messages).
We do not expect any changes to existing dashboards will be needed. The selection of text from the secondary label will be automatically transformed into a selection of individual attribute values with the value of the secondary label.
More details will be provided in upcoming release notes.
GoodData.CN 3.14
We are introducing the ability to use datasets from different data sources in an LDM and connect them using common date dimension datasets. This allows you to apply a common date filter across datasets from different data sources. See Using Multiple Data Sources in an LDM.
Please note that this is a beta feature currently in early development, so its functionality is limited at this stage.
We are going to update how attribute filters handle values with non-unique secondary labels, such as users sharing the same User Name.
Current Behaviour:
When an attribute (e.g., User) has a unique primary label (e.g., User ID: 1234) and a more readable secondary label (e.g., User Name: John Doe), filtering by the User Name (if multiple users are named John Doe) results in all John Does being combined into a single filter value.
New Behavior:
The improved filter will display each attribute value even if the secondary label is not unique. This means you will see all instances of John Doe separately, with a tooltip showing the primary label (e.g., User ID) to help differentiate them. The filter’s behavior will be consistent across dashboards, visualizations, and drilling or exploring further interactions, regardless of which label is displayed.
This change is straightforward for end users. However, there will be a new ‘Display as’ parameter in the metadata to indicate which label should represent the attribute in the GUI. This parameter must be considered when using filters in dashboards, visualizations, drilling, POST messages and events, SDK filter definitions, and cross-filtering. More details will be provided in upcoming release notes.
GoodData.CN 3.13
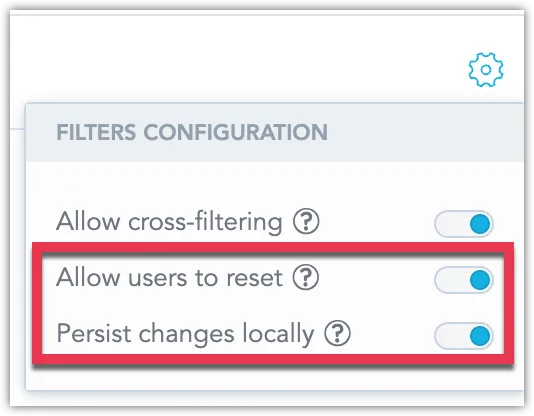
We’ve added new options to give you more control over dashboard filters. You can now disable the “Reset All Filters” button to ensure users follow a guided data experience. Additionally, you can prevent filter changes from being saved in the user’s browser, so each visit shows the default filter settings. See Disable Resetting Filters.
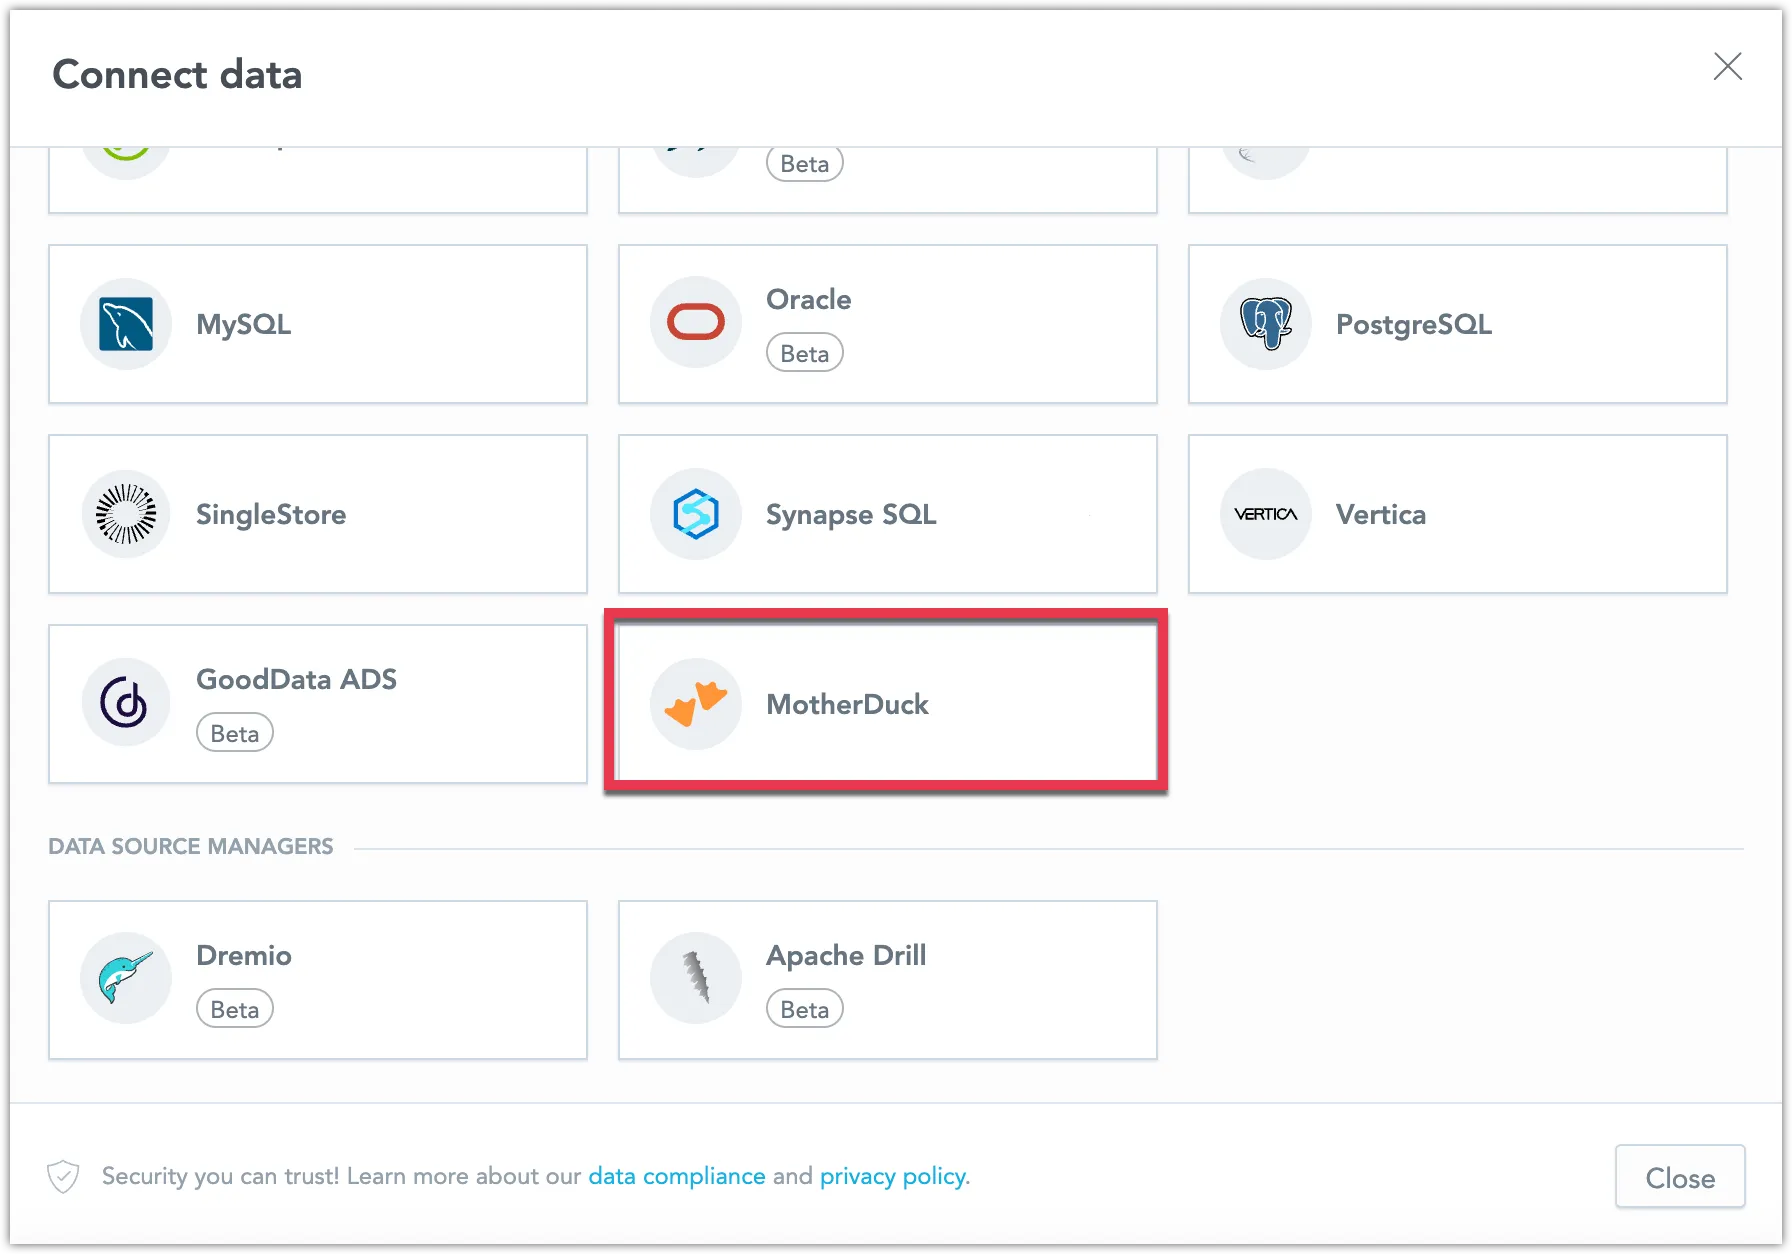
You can now connect directly to a MotherDuck database and create a MotherDuck data source within GoodData. This new feature expands your data connectivity options, allowing you to integrate MotherDuck seamlessly into your workflows. See MotherDuck Data Source.
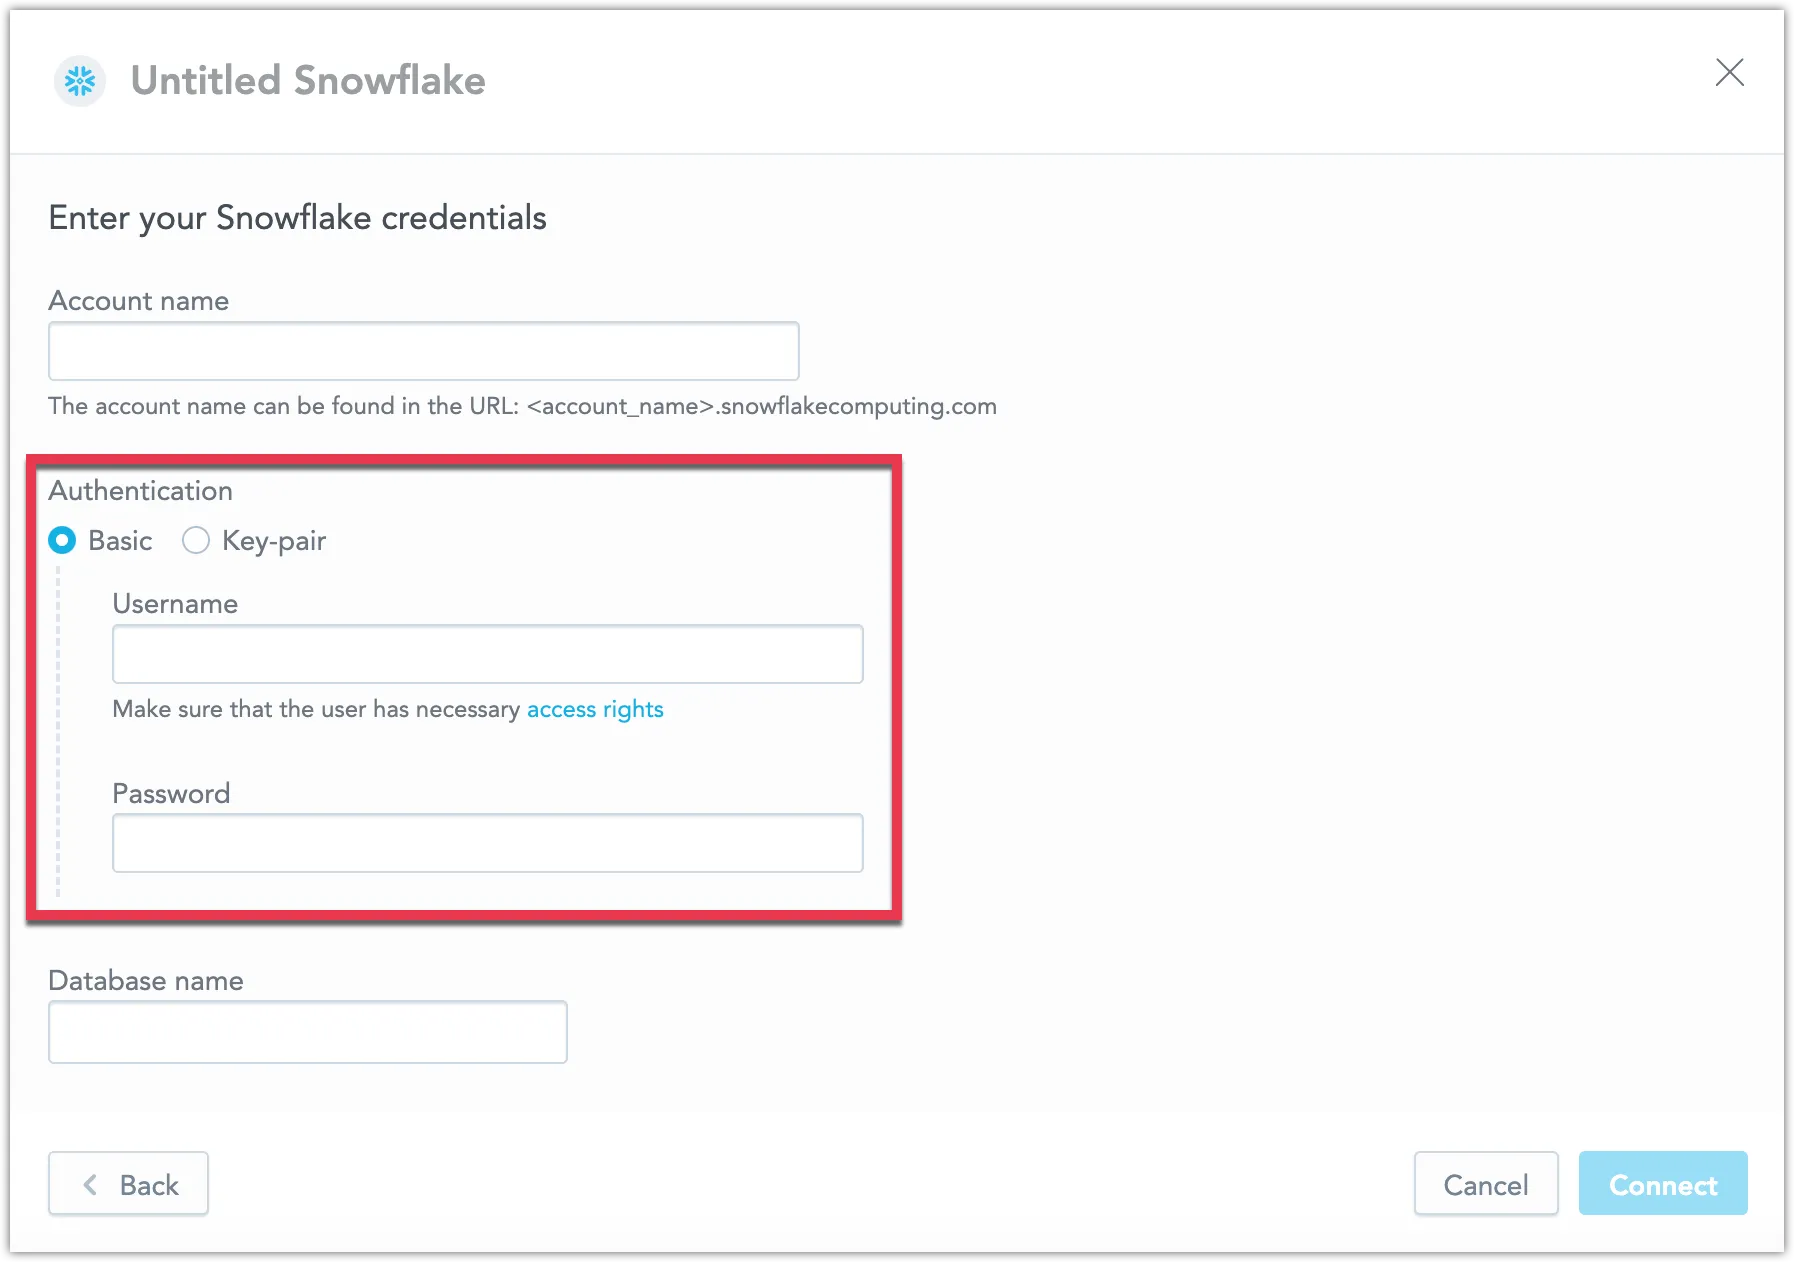
We now support key-pair authentication for Snowflake data sources. This secure method allows you to connect using private and public key pairs, enhancing your data protection. See Create a Snowflake Data Source.
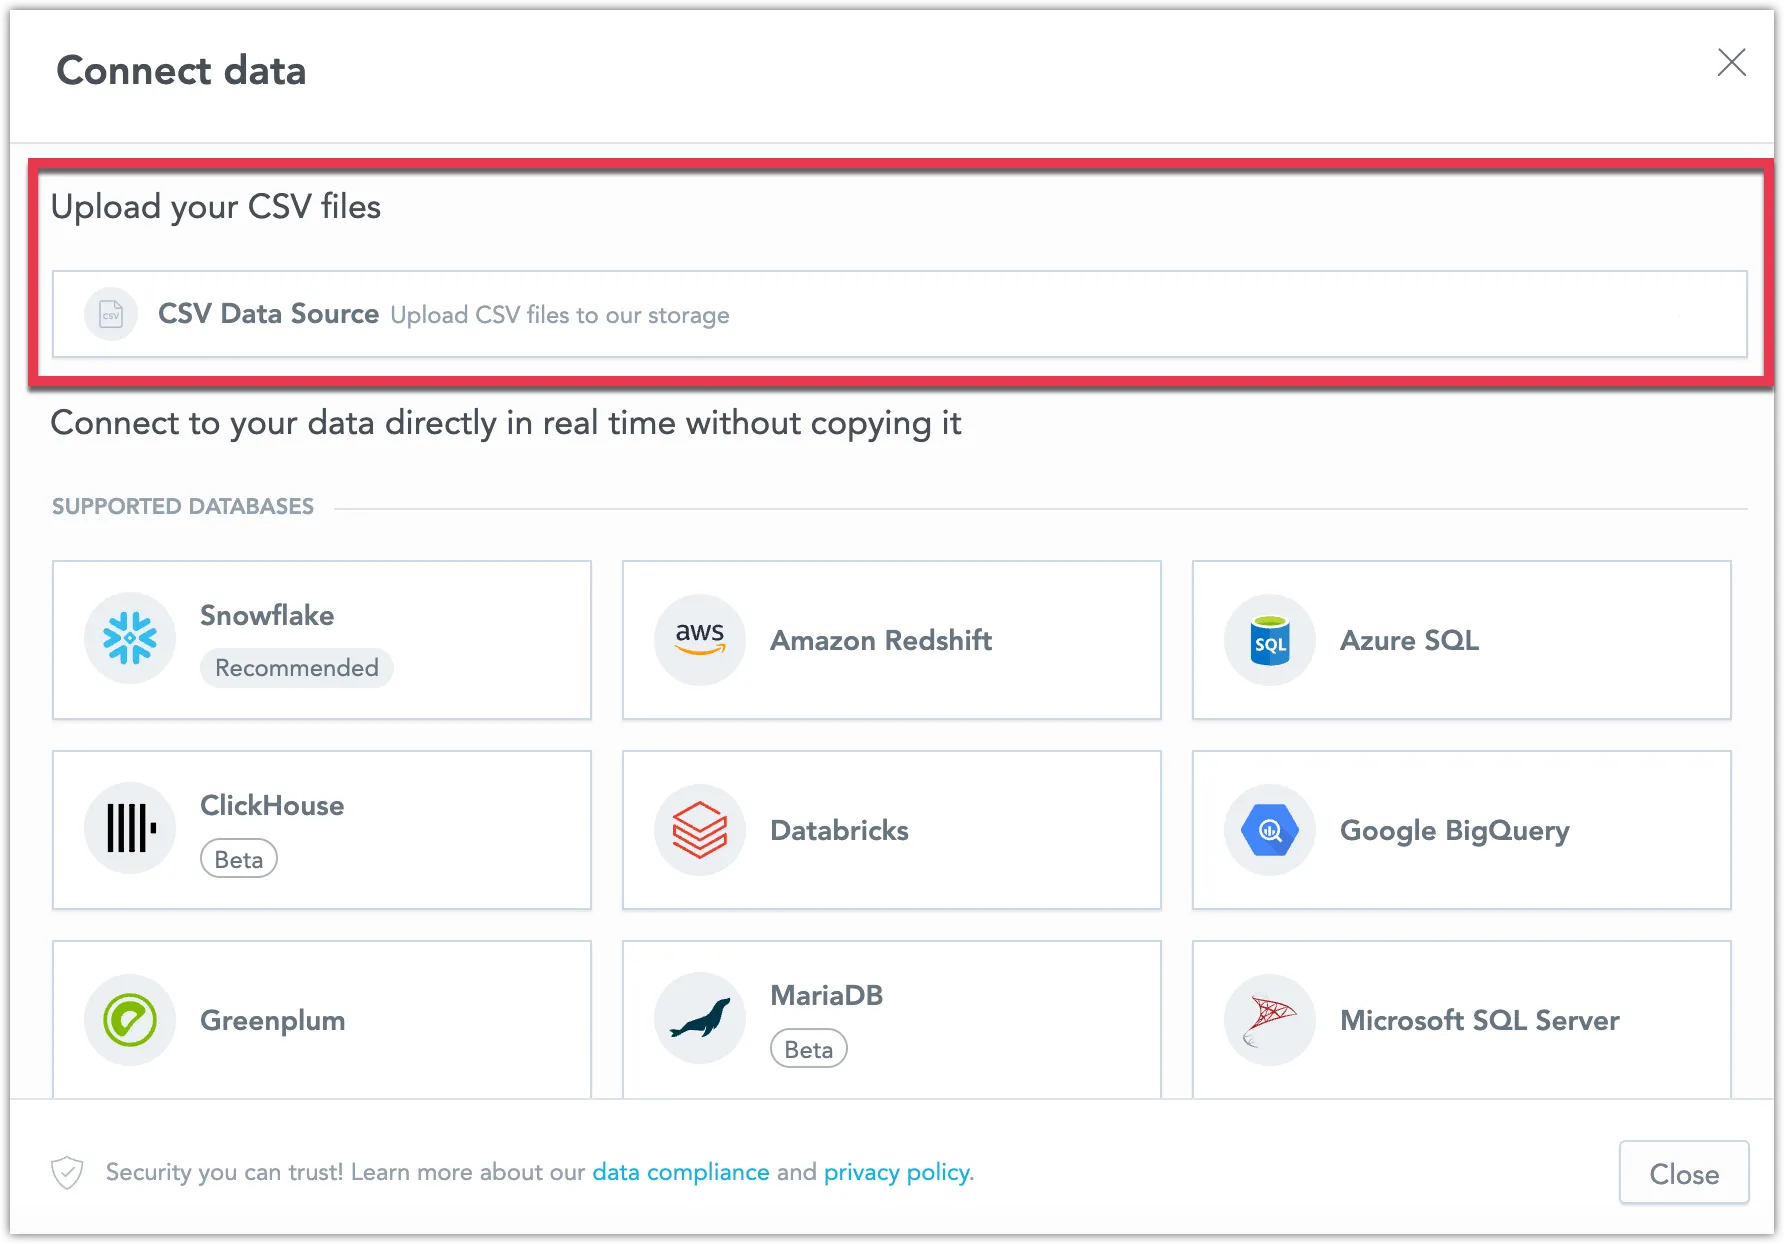
We are excited to announce that uploading CSV files as a data source is now fully supported and out of beta! You can now assemble a data source using an unlimited number of CSV files, with each file up to 200MB and a combined limit of 1GB. You can also disable this feature using the API. See Upload CSV Files.
Today we have released new version of GoodData.UI with the following notable changes:
- You can now specify the
returnToparameter with the backenddeauthenticatefunction for a more seamless user experience. - The export function now supports PDF options, offering greater flexibility in how you share your data.
- The
visualizationObjectwill now be used instead ofexecutionResultfor export operations whenever possible, improving the efficiency of your exports.
We are also releasing a new version of the Python SDK today. This update includes only minor changes, such as version bumps, for details see the changelog.